Hydrophobicity
CLC Genomics Workbench can calculate the hydrophobicity of protein sequences in different ways, using different algorithms. (See Bioinformatics explained: Protein hydrophobicity). Furthermore, hydrophobicity of sequences can be displayed as hydrophobicity plots and as graphs along sequences . In addition, CLC Genomics Workbench can calculate hydrophobicity for several sequences at the same time, and for alignments.
Displaying the hydrophobicity for a protein sequence in a plot is done in the following way:
Toolbox | Classical Sequence Analysis (![]() ) | Protein Analysis (
) | Protein Analysis (![]() )| Create Hydrophobicity Plot (
)| Create Hydrophobicity Plot (![]() )
)
This opens a dialog. The first step allows you to add or remove sequences. If you had already selected a sequence in the Navigation Area, this will be shown in the Selected Elements.Clicking Next takes you through to Step 2, which is displayed in figure 15.5.
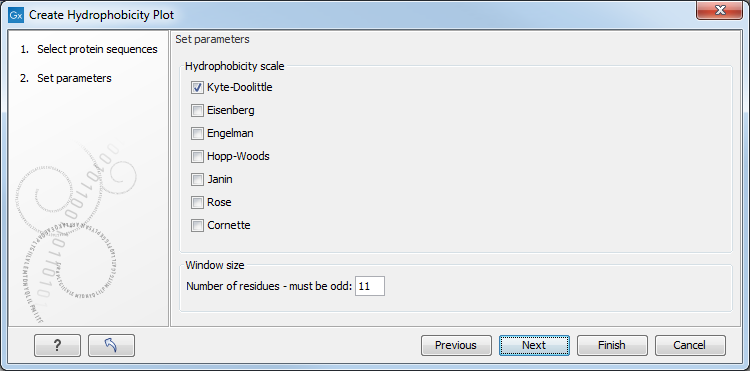
Figure 15.5: Step two in the Hydrophobicity Plot allows you to choose hydrophobicity scale and
the window size.
The Window size is the width of the window where the hydrophobicity is calculated. The wider the window, the less volatile the graph. You can chose from a number of hydrophobicity scales which are further explained in Bioinformatics explained: Protein hydrophobicity Click Finish to start the tool. The result can be seen in figure 15.6.
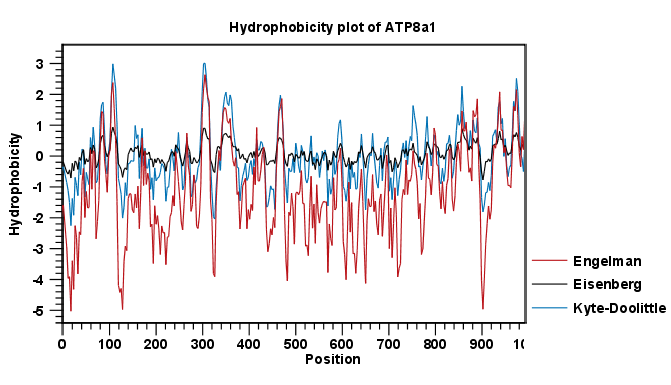
Figure 15.6: The result of the hydrophobicity plot calculation and the associated
Side Panel.
See Graph preferences for information about the graph view.
Subsections