Create GC Content Graph
The Create GC Content Graph tool needs a sequence track as input and will create a graph track with the GC contents of that sequence.
To run the tool go to the toolbox:
Toolbox | Track Tools (![]() ) | Graphs | Create GC Content Graph
) | Graphs | Create GC Content Graph
Select the sequence track that should be used as input (see figure 23.24).
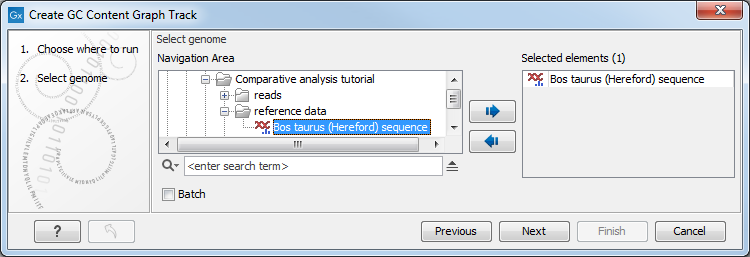
Figure 23.24: Select the sequence track that should be used as input.
In the next wizard step (see figure 23.25), you can specify the window size, i.e., the size of the window around the central base in the region that is used to calculate the GC content. This number must be odd as you need a central base and an equal number of bases to each side of the central base. For example, with a window size of 25, the GC content for the central base will be calculated based on the nucleotide composition in the central base and the 12 bases upstream and 12 bases downstream of the central base.
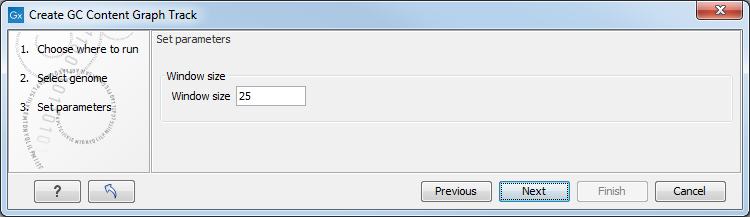
Figure 23.25: Specify the window size. The window size is the region around each individual base that should be used to calculate the GC content in a given region.
Click on the button labeled Next, choose to save your results, and click on the button labeled Finish. The output can be seen in figure 23.26. The output from "Create GC Content Graph" is a graph track. The graph track shows one value for each base with one graph being available for each chromosome. When zoomed out as shown in this figure, three different graphs with three different colors can be seen. The top graph with the darkest blue color represents the maximum observed GC content values in the specific region, the graph in the middle with the intermediate blue color shows the mean observed GC content values in the specific region, and the graph at the bottom with the light blue color shows the minimum observed GC content values in the specific region.
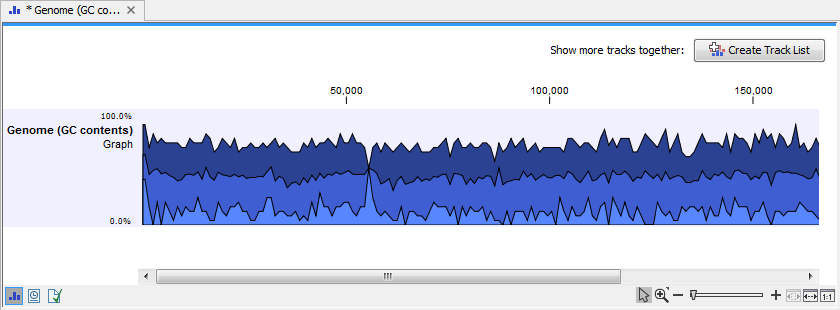
Figure 23.26: The output from "Create GC Content Graph" is a graph track. The graph track shows one value for each base with one graph being available for each chromosome.
When zooming all the way in to single nucleotide level only one graph can now be seen as you ar now no longer looking at large genomic regions. Instead, you can now use the tooltip by mousing over each individual base to look at the GC content for that particular base and the number of bases that you specified as the window size to be used. This is shown in figure 23.27 where the top part of the figure shows the graph track when zoomed all the way out and the bottom part of the figure shows a track list with the sequence track that was used as input together with the output graph track. The input and the output tracks were combined in one view as a track list by clicking on the button labeled Create Track List found in the upper right corner of the graph track in the top part of the figure (see the red arrow).
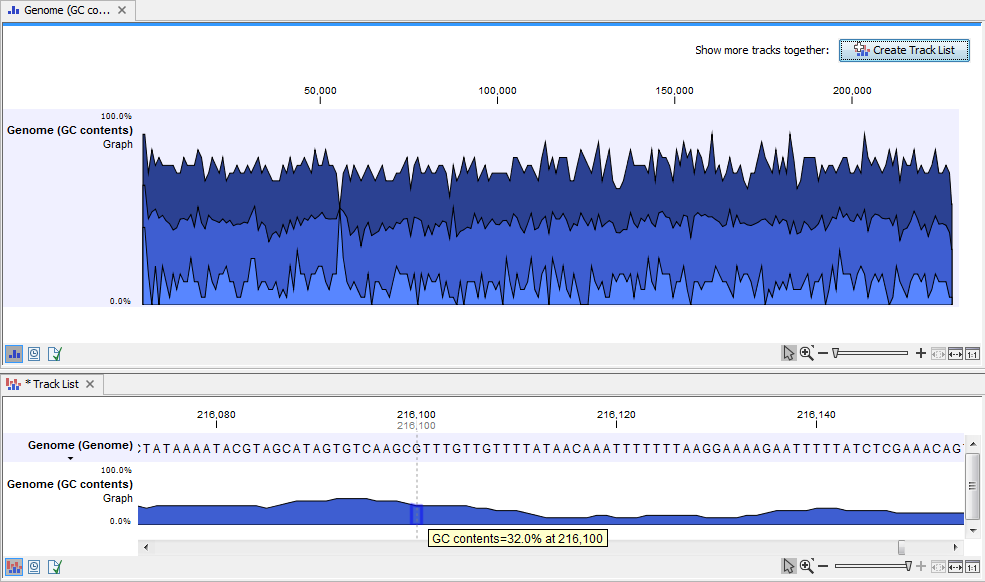
Figure 23.27: The top part of the figure shows the graph track when zoomed all the way out. The bottom part of the window shows a graph track together with the input genomic sequence at single nucleotide resolution. By mousing over one nucleotide, you can see the GC content for this position. In our example we chose a window size of 25 nucleotides and the GC content that is shown for one nucleotide is the GC content for the central nucleotide and the 12 bases upstream and downstream of this nucleotide.