Coverage graph
The coverage graph is a graphical presentation of the coverage for each position in all the targets (positions outside the targets will have the value 0). The values are calculated by the "Target regions statistics" tool, and are presented with the reference position on the x-axis and the coverage on the y-axis (see figure 25.9). The x-axis and y-axis values are identical to those found in the columns of the coverage table.
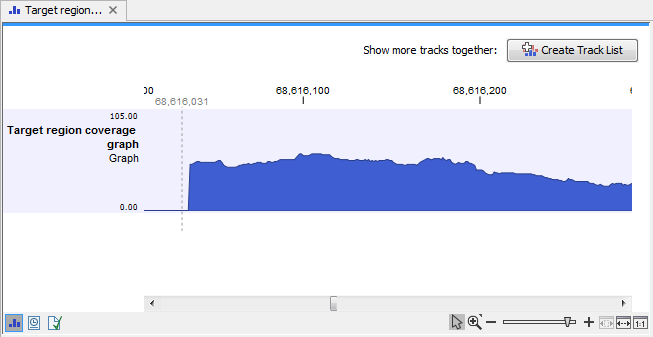
Figure 25.9: An example of a targeted region coverage graph.