The expression browser
An Expression Browser is shown in figure 26.33.
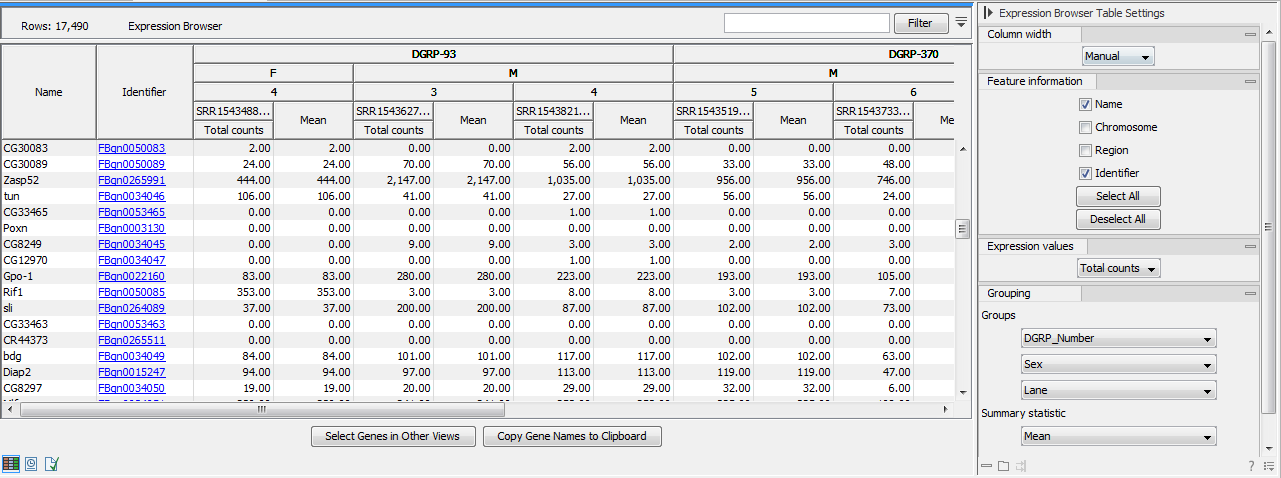
Figure 26.33: Expression browser table when no statistical comparison or annotations resources were provided.
Each row represents a gene or a transcript, defined by its name, the chromosome and the region where it is located, as well as an identifier linking to the relevant online database.
The expression values for each sample - or aggregation of samples - can be given by total counts, RPKM, TPM or CPM (Counts Per Million). These measurements differ from each other in two key ways:
- RPKM and TPM measure the number of transcripts whereas total counts and CPM measure the number of reads. The distinction is important because in an RNA-Seq experiment, more reads are typically sequenced from longer transcripts than from shorter ones.
- RPKM, TPM and CPM are normalized for sequencing-depth so their values are comparable between samples. Total counts is not normalized, so values are not comparable between samples.
|
How do I get the normalized counts used to calculate fold changes? The CPM expression values are most comparable to the results of the Differential Expression for RNA-Seq tool. However, normalized counts are not used to calculate fold changes; instead the Differential Expression for RNA-Seq tool works by fitting a statistical model (which accounts for differences in sequencing-depth) to raw counts. It is therefore not possible to derive these fold changes from the CPM values by simple algebraic calculations. |
It is possible to display the values for individual samples, or for groups of samples as defined by the metadata. Using the drop down menus in the "Grouping" section of the right-hand side setting panel, you can choose to group samples according to up to three metadata layers as shown in figure 26.33.
When individual samples are aggregated, an additional "summary statistic" column can be displayed to give either the mean, the minimum, or the maximum expression value for each group of samples. The table in figure 26.33 shows the mean of the expression values for the first group layer that was selected.
If one or more statistical comparisons are provided, extra columns can be displayed in the table using the "Statistical comparison" section of the Settings panel (figure 26.34). The columns correspond to the different statistical values generated by the "Differential Expression for RNA-seq" as detailed in Statistical comparison tracks.
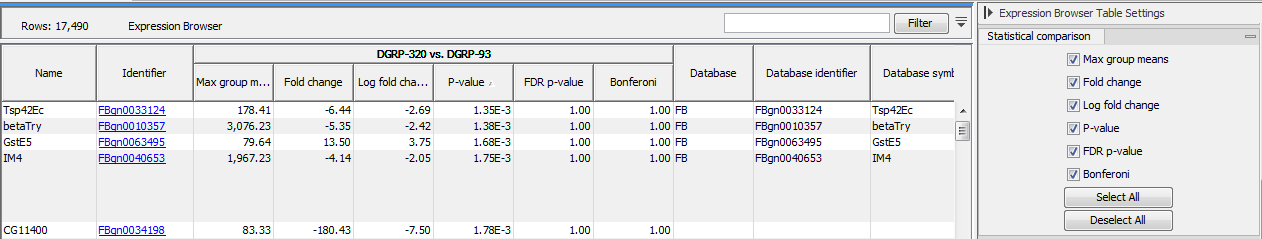
Figure 26.34: Expression browser table when a statistical comparison is present.
If an annotation database is provided, extra columns can be displayed in the table using the "Annotation" section of the Settings panel (figure 26.35). Which columns are available depends on the annotation file used. When using a GO annotation file, the GO biological process column will list for each gene or transcript one or several biological processes. Click on the process name to open the corresponding page on the Consortium for Gene Ontology webpage. It is also possible to access additional online information by clicking on the the PMID, RefSeq, HGNC or UniProt accession number when available.
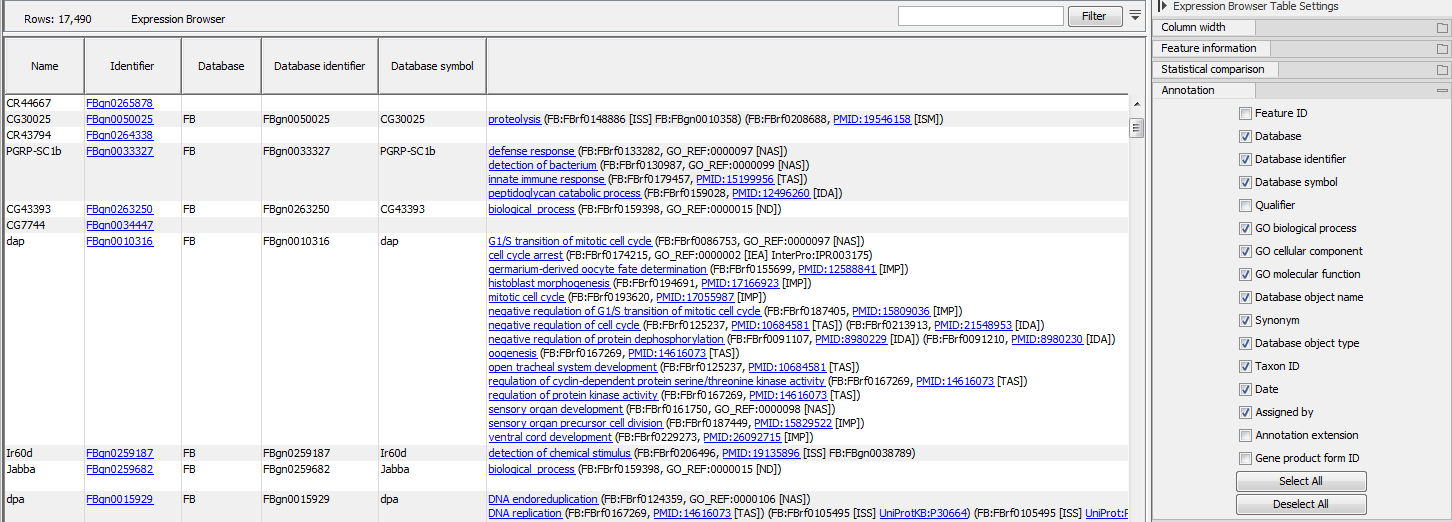
Figure 26.35: Expression browser table when a GO annotation file is present.
Select the genes of interest and use the button present at the bottom of the table to highlight the genes in other views (volcano plot for instance) or to copy the genes of interest to a clipboard.