Annotating and merging small RNA samples
The small RNA sample produced when counting the tags can be enriched by CLC Genomics Workbench by comparing the tag sequences with annotation resources such as miRBase and other small RNA annotation sources. Note that the annotation can also be performed on an experiment, set up from small RNA samples (see Setting up an experiment).
Besides adding annotations to known small RNAs in the sample, it is also possible to merge variants of the same small RNA to get a cumulative count. When initially counting the tags, the Workbench requires that the trimmed reads are identical for them to be counted as the same tag. However, you will often see different variants of the same miRNA in a sample, and it is useful to be able to count these together. This is also possible using the tool to annotate and merge samples.
Toolbox | Microarray and Small RNA Analysis | Small RNA Analysis (![]() ) | Annotate and Merge Counts (
) | Annotate and Merge Counts (![]() )
)
This will open a dialog where you select the small RNA samples (![]() ) to be annotated. Note that if you have included several samples, they will be processed separately but summarized in one report providing a good overview of all samples. You can also input Experiments (
) to be annotated. Note that if you have included several samples, they will be processed separately but summarized in one report providing a good overview of all samples. You can also input Experiments (![]() ) (see Setting up an experiment) created from small RNA samples. Click Next when the data is listed in the right-hand side of the dialog.
) (see Setting up an experiment) created from small RNA samples. Click Next when the data is listed in the right-hand side of the dialog.
This dialog (figure 27.7) is where you define the annotation resources to be used.
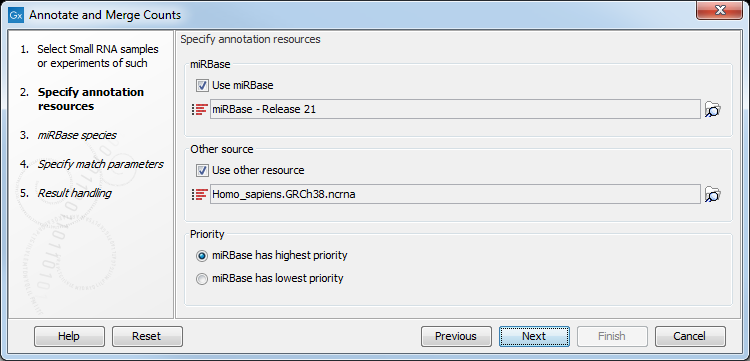
Figure 27.7: Defining annotation resources.
There are two ways of providing annotation sources:
- Downloading miRBase using the integrated download tool (explained in downloading miRBase).
- Importing a list of sequences, e.g. from a fasta file. This could be from Ensembl, e.g. ftp://ftp.ensembl.org/pub/release-57/fasta/homo_sapiens/ncrna/Homo_sapiens.GRCh37.57.ncrna.fa.gz or from ncRNA.org: http://togodb.biosciencedbc.jp/togodb/view/frnadb_summary.
Note: We recommend using the integrated download tool to import miRBase. Although it is possible to import it as a fasta file, the same options with regards to species will not be available if you import from a file.
The downloaded miRBase file contains all precursor sequences from the latest version of miRBase http://www.mirbase.org/ including annotations defining the mature regions (see an example in figure 27.8).
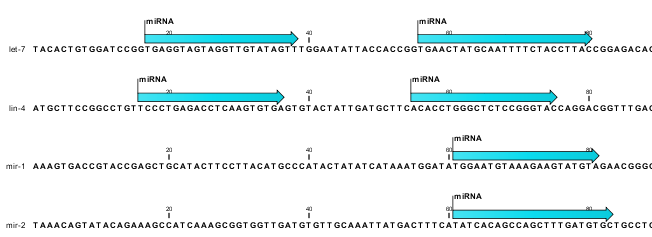
Figure 27.8: Some of the precursor miRNAs from miRBase have both 3' and 5' mature regions (previously referred to as mature and mature*) annotated (as the two first in this list).
This means that it is possible to have a more fine-grained classification of the tags using miRBase compared to a simple fasta file resource containing the full precursor sequence. This is the reason why the miRBase annotation source is specified separately in figure 27.7.
At the bottom of the dialog, you can specify whether miRBase should be prioritized over the additional annotation resource. The prioritization is explained in detail later in this section. To prioritize one over the other can be useful when there is redundant information (e.g. if you have an additional source that also contains all the miRNAs from miRBase and you prefer the miRBase annotations when possible).
When you click Next, you will be able to choose which species from miRBase should be used and in which order (see figure 27.9). Note that if you have not selected a miRBase annotation source, you will go directly to the next step shown in figure 27.10.
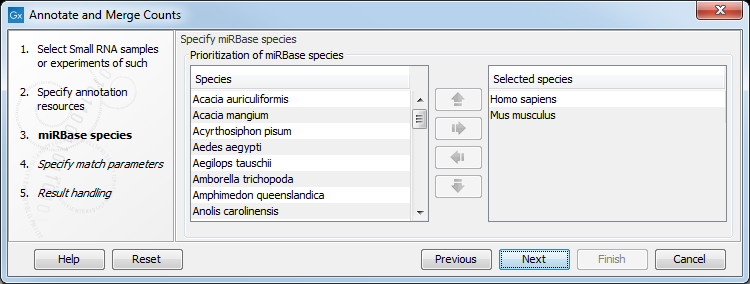
Figure 27.9: Defining and prioritizing species in miRBase.
To the left, you see the list of species in miRBase. This list is dynamically created based on the information in the miRBase file. Using the arrow button (![]() ) you can add species to the right-hand panel. The order of the species is important since the tags are annotated iteratively based on the order specified here. This means that in the example in figure 27.9, a human miRNA will be preferred over mouse, even if they are identical in sequence (the prioritization is elaborated below). The up and down arrows (
) you can add species to the right-hand panel. The order of the species is important since the tags are annotated iteratively based on the order specified here. This means that in the example in figure 27.9, a human miRNA will be preferred over mouse, even if they are identical in sequence (the prioritization is elaborated below). The up and down arrows (![]() )/ (
)/ (![]() ) can be used to change the order of species.
) can be used to change the order of species.
When you click Next, you will be able to specify how the alignment of the tags against the annotation sources should be performed (see figure 27.10).
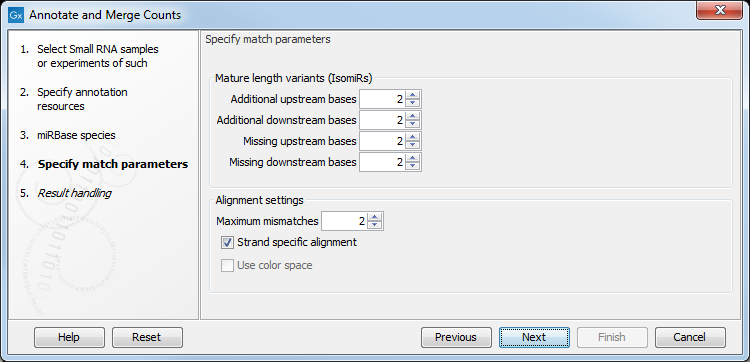
Figure 27.10: Setting parameters for aligning.
The panel at the top is active only if you have chosen to annotate with miRBase. It is used to define the requirements to the alignment of a read for it to be counted as a 3' or 5' mature region (previously referred to as mature and mature*) tag:
- Additional upstream bases
- This defines how many bases the tag is allowed to extend the annotated mature region at the 5' end and still be categorized as mature.
- Additional downstream bases
- This defines how many bases the tag is allowed to extend the annotated mature region at the 3' end and still be categorized as mature.
- Missing upstream bases
- This defines how many bases the tag is allowed to miss at the 5' end compared to the annotated mature region and still be categorized as mature.
- Missing downstream bases
- This defines how many bases the tag is allowed to miss at the 3' end compared to the annotated mature region and still be categorized as mature.
At the bottom of the dialog you can specify the Maximum mismatches (default value is 2). Furthermore, you can specify if the alignment and annotation should be performed in color space which is available when your small RNA sample is based on SOLiD data. 27.3 Finally, you can choose whether the tags should be aligned against both strands of the reference or only the positive strand. Usually it is only necessary to align against the positive strand.
At this point, a more elaborate explanation of the annotation algorithm is needed. The short read mapping algorithm in the CLC Genomics Workbench is used to map all the tags to the reference sequences which comprise the full precursor sequences from miRBase and the sequence lists chosen as additional resources. The mapping is done in several rounds: the first round is done requiring a perfect match, the second allowing one mismatch, the third allowing two mismatches etc. No gaps are allowed. The number of rounds depend on the number of mismatches allowed27.4 (default is two which means three rounds of read mapping, see figure 27.10).
After each round of mapping, the tags that are mapped will be removed from the list of tags that continue to the next round. This means that a tag mapping with perfect match in the first round will not be considered for the subsequent one-mismatch round of mapping.
Note: If there are mismatches in the read, there will be a limitation on how short reads can be mapped:
- A minimum read length of 17 nucleotides is required when the read contains one mismatch.
- A minimum read length of 21 nucleotides is required when the read contains two mismatches.
- A minimum read length of 25 nucleotides is required when the read contains three mismatches.
Following the mapping, the tags are classified into the following categories according to where they match.
- Mature 5' exact
- Mature 5' super
- Mature 5' sub
- Mature 5' sub/super
- Mature 3' exact
- Mature 3' super
- Mature 3' sub
- Mature 3' sub/super
- Precursor
- Other
An example of an alignment is shown in figure 27.11 using the same alignment settings as in figure 27.10.
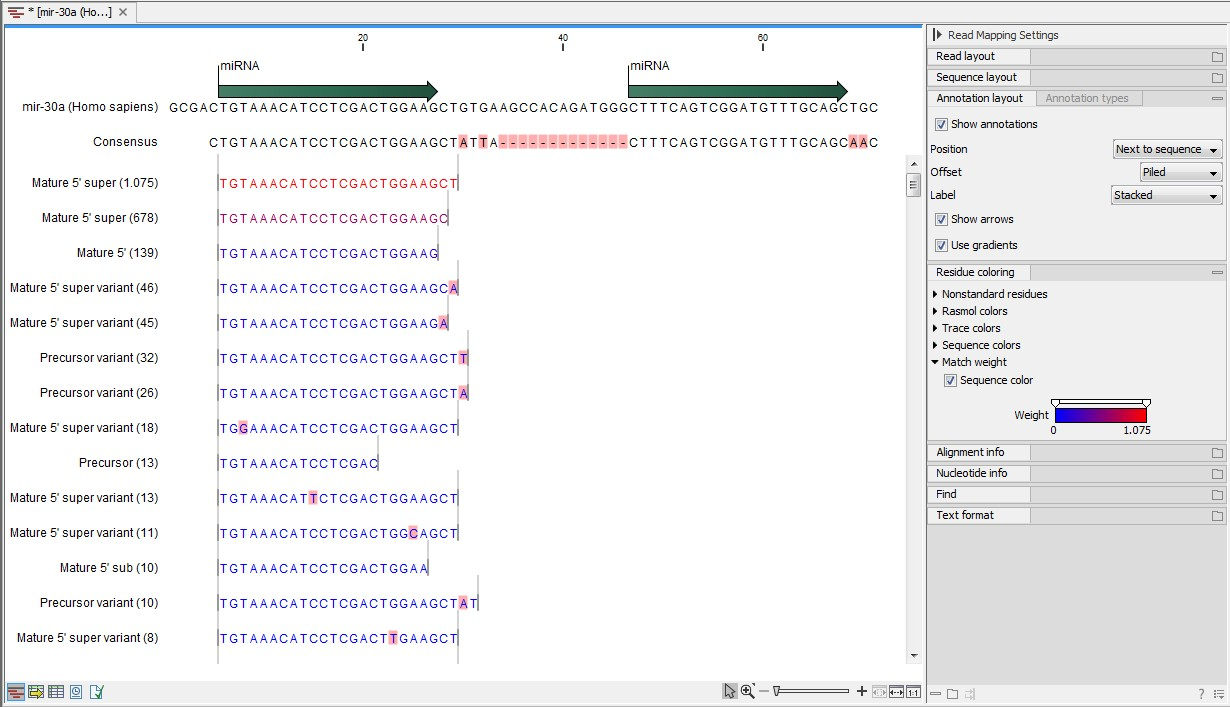
Figure 27.11: Alignment of length variants of mir-30a.
The two tags at the top are both classified as mature 5' super because they cover and extend beyond the annotated mature 5' RNA. The third tag is identical to the annotated mature 5'.
If a tag has several hits, the list above is used for prioritization. This means that for example, a Mature 5' sub is preferred over a Mature 3' exact. Note that if miRBase was chosen as lowest priority (figure 27.7), the Other category will be at the top of the list. All tags mapping to a miRBase reference without qualifying to any of the mature 5' and mature 3' types will be typed as Other. Also note that if a tag has several hits to references with the same priority (e.g. the tag matches the mature regions of two different miRBase sequences) it will be annotated with all these sequences. In the report we refer to these tags as 'ambiguously annotated'.
In case you have selected more than one species for miRBase annotation (e.g. Homo Sapiens and Mus Musculus) the following rules for adding annotations apply:
- If a tag has hits with the same priority for both species, the annotation for the top-prioritized species will be added.
- Read category priority is stronger than species category priority: If a read is a higher priority match for a mouse miRBase sequence than it is for a human miRBase sequence the annotation for the mouse will be used
Clicking Next allows you to specify the output of the analysis as shown in 27.12.
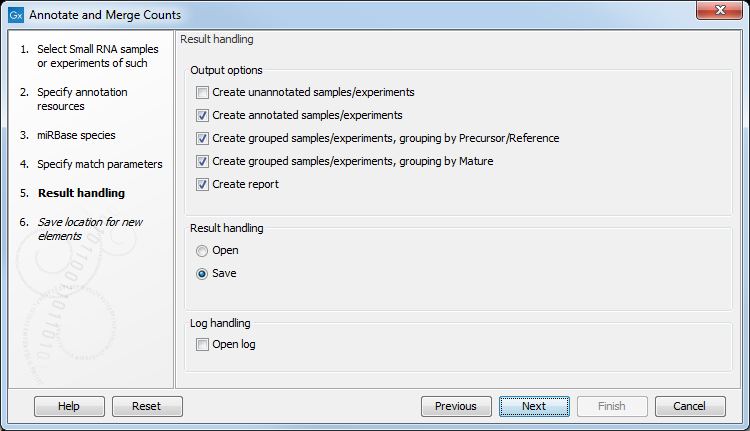
The options are:
- Create unannotated sample
- All the tags where no hit was found in the annotation source are included in the unannotated sample. This sample can be used for investigating novel miRNAs, see Exploring novel miRNAs. No extra information is added, so this is just a subset of the input sample.
- Create annotated sample
- This will create a sample as described in The un-grouped sample. In this sample, the following columns have been added to the counts.
- Name
- This is the name of the annotation sequence in the annotation source. For miRBase, it will be the names of the miRNAs (e.g. let-7g or mir-147), and for other source, it will be the name of the sequence.
- Resource
- This is the source of the annotation, either miRBase (in which case the species name will be shown) or other sources (e.g. Homo_sapiens.GRCh37.57.ncrna).
- Match type
- The match type can be exact or variant (with mismatches) of the following types:
- Mature 5'
- Mature 5' super
- Mature 5' sub
- Mature 5' sub/super
- Mature 3'
- Mature 3' super
- Mature 3' sub
- Mature 3' sub/super
- Other
- Mismatches
- The number of mismatches.
- Create grouped sample, grouping by Precursor/Reference
- This will create a sample as described in The grouped sample. All variants of the same reference sequence will be merged to create one expression value for all.
- Expression values.
- The expression value can be changed at the bottom of the table. The default is to use the counts in the mature 5' column.
- Name.
- The name of the reference. For miRBase this will then be the name of the precursor.
- Resource.
- The name of the resource that the reference comes from.
- Exact mature 5'.
- The number of exact mature 5' reads.
- Mature 5'.
- The number of all mature 5' reads including sub, super and variants.
- Unique exact mature 5'.
- In cases where one tag has several hits (as denoted by the // in the ungrouped annotated sample as described above), the counts are distributed evenly across the references. The difference between Exact mature 5' and Unique exact mature 5' is that the latter only includes reads that are unique to this reference.
- Unique mature 5'.
- Same as above but for all mature 5's, including sub, super and variants.
- Exact mature 3'.
- Same as above, but for mature 3'.
- Mature 3'.
- Same as above, but for mature 3'.
- Unique exact mature '3.
- Same as above, but for mature 3'.
- Unique mature '3.
- Same as above, but for mature 3'.
- Exact other.
- Exact matches in miRBase sequences, but outside annotated mature regions.
- Other.
- All matches in miRBase sequences, but outside annotated mature regions, including variants.
- Total.
- The total number of tags mapped and classified to the precursor/reference sequence.
- Create grouped sample, grouping by Mature
- This will create a sample as described in The grouped sample. This is also a grouped sample, but in addition to grouping based on the same reference sequence, the tags in this sample are grouped on the same mature 5'. This means that two precursor variants of the same mature 5' miRNA are merged. For precursor miRNAs that have both a 5' and a 3', we group on both 5' mature and 3' mature. For these miRNAs you will see two rows in the grouped on mature output table, one with the 5' mature sequence as feature ID and one with the 3' mature sequence as feature ID. The 'Match type' column indicates whether the feature ID is 5' or 3' mature. Note that it is only possible to create this sample when using miRBase as annotation resource (because the Workbench has a special interpretation of the miRBase annotations for mature as described previously). To find identical mature 5' miRNAs, the Workbench compares all the mature 5' sequences and when they are identical, they are merged. The names of the precursor sequences merged are all shown in the table.
- Expression values.
- The expression value can be changed at the bottom of the table. The default is to use the counts in the mature 5' column.
- Name.
- The name of the reference. When several precursor sequences have been merged, all the names will be shown separated by //.
- Resource.
- The species of the reference.
- Exact mature 5'.
- The number of exact mature 5' reads.
- Mature 5'.
- The number of all mature 5' reads including sub, super and variants.
- Unique exact mature 5'.
- In cases where one tag has several hits (as denoted by the // in the ungrouped annotated sample as described above), the counts are distributed evenly across the references. The difference between Exact mature 5' and Unique exact mature 5' is that the latter only includes reads that are unique to one of the precursor sequences that are represented under this mature 5' sequence.
- Unique mature 5'.
- Same as above but for all mature 5's, including sub, super and variants.
- Create report.
- A summary report described below.
The summary report includes the following information (an example is shown in figure 27.13):
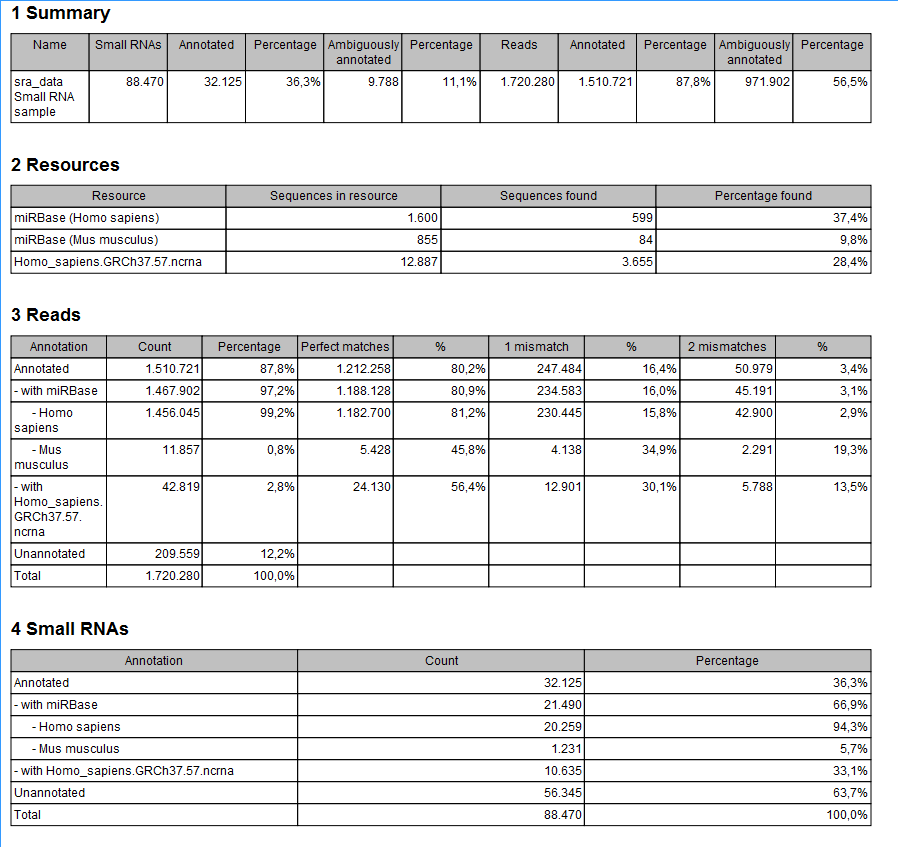
Figure 27.13: A summary report of the annotation.
- Summary
- Shows the following information for each input sample:
- Number of small RNAs(tags) in the input.
- Number of annotated tags (number and percentage).
- Number of ambiguously annotated tags (number and percentage).
- Number of reads in the sample (one tag can represent several reads)
- Number of annotated reads (number and percentage).
- Number of ambiguously annotated reads (number and percentage).
- Resources
- Shows how many matches were found in each resource:
- Number of sequences in the resource.
- Number of sequences where a match was found (i.e. this sequence has been observed at least once in the sequencing data).
- Reads
- Shows the number of reads that fall into different categories (there is one table per input sample). On the left hand side are the annotation resources. For each resource, the count and percentage of reads in that category are shown. Note that the percentage are relative to the overall categories (e.g. the miRBase reads are a percentage of all the annotated reads, not all reads). This is information is shown for each mismatch level.
- Small RNAs
- Similar numbers as for the reads but this time for each small RNA tag and without mismatch differentiation.
- Read count proportions
- A histogram showing, for each interval of read counts, the proportion of annotated (respectively, unannotated) small RNAs with a read count in that interval. Annotated small RNAs may be expected to be associated with higher counts, since the most abundant small RNAs are likely to be known already.
- Annotations (miRBase)
- Shows an overview table for classifications of the number of reads that fall in the miRBase categories for each species selected.
- Annotations (Other)
- Shows an overview table with read numbers for total, exact match and mutant variants for each of the other annotation resources.
An example of the results table is shown at the bottom of figure 27.14.
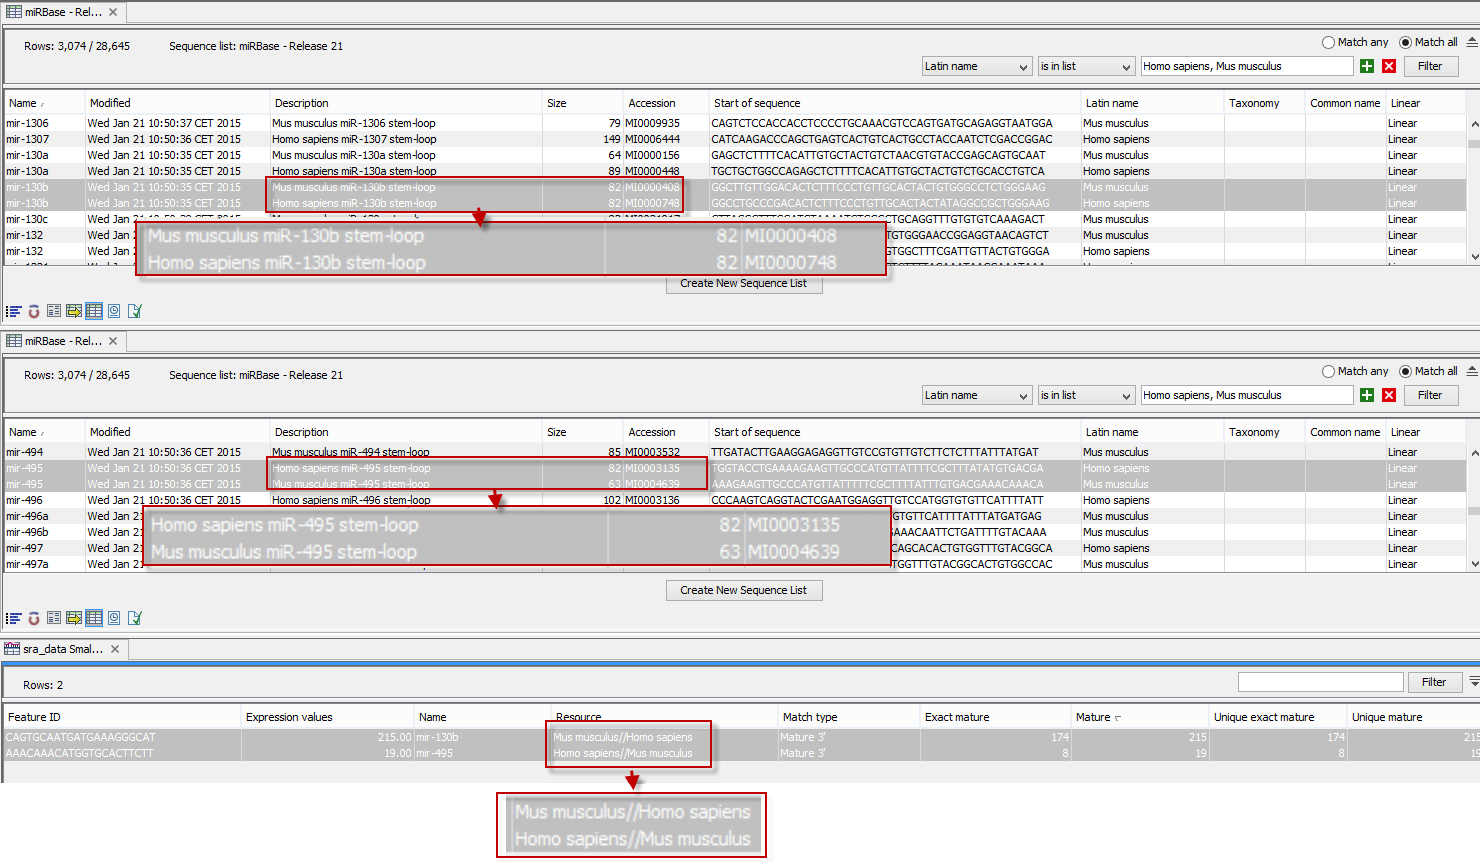
Figure 27.14: The results table (at the bottom of the figure) shown in split view with the imported miRBase data shown twice to illustrate that the order in which the resource is listed is determined by the miRBase accession number. Due to the very small fonts in the table, the most important information has been magnified (red box).
In the upper part of the figure, you can see two tables showing the imported miRBase file (opened twice for illustration purpose). This example has been included to illustrate the logic behind the order in which the resources are listed. If you look at the results table found at the bottom of the figure, you will see that in the Resource column, Mus musculus is listed before Homo sapiens in the first row and in the second row Homo sapiens is listed before Mus musculus. The rationale behind this can be seen from the two other tables if you look at the accession numbers. If you filter only to include Homo sapiens and Mus musculus RNAs, and sort on the "name" column, you can see that for mir-130b (Mus musculus/Homo sapiens), the miRBase number of the mouse RNA is smaller than the miRBase number of the human RNA. Conversely, for mir-495 (Homo sapiens/Mus musculus), the number is smaller in the human case.
Footnotes
- ... data.27.3
- Note that this option is only going to make a difference for tags with low counts. Since the actual tag counting in the first place is done based on perfect matches, the highly abundant tags are not likely to have sequencing errors, and aligning in color space does not add extra benefit for these.
- ... allowed27.4
- For color space, the maximum number of mismatches is 2.