Coverage analysis
The coverage analysis tool is designed to identify regions in read mappings with unexpectedly low or high coverage. Such regions may be indicative of a deletion or an amplification in the sample relative to the reference. The algorithm fits a Poisson distribution to the observed coverage in the positions of the mapping. This distribution is used as the basis for identifying the regions of 'Low coverage' or 'High coverage'. The user chooses two parameter values in the wizard: (1) a 'Minimum length' and (2) a 'P-value threshold' value. The algorithm inspects the coverage in each of the positions in the read mapping and marks the ones with coverage in the lower or upper tails of the estimated Poisson distribution, using the provided p-value as cut-off. Regions with consecutive positions marked consistently as having low (respectively high) coverage, longer than the user specified 'Minimum length' value are called as 'Low coverage' (respectively 'High coverage') regions.To run the Coverage analysis tool:
Toolbox | Resequencing Analysis (![]() ) |
Coverage Analysis (
) |
Coverage Analysis (![]() )
)
In the first dialog, select a reads track or read mapping and click Next. This opens the dialog shown in figure 25.24.
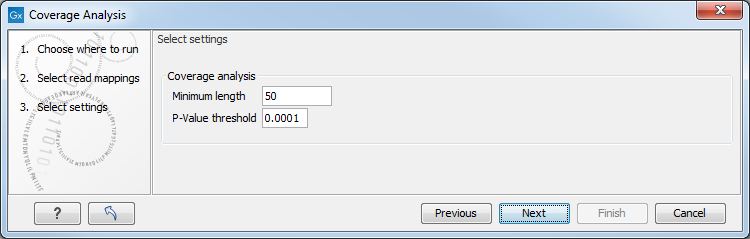
Figure 25.24: Specify the p-value cutoff.
Set the p-value and minimum length cutoff. Click Next and specify the result handling (figure 25.25).
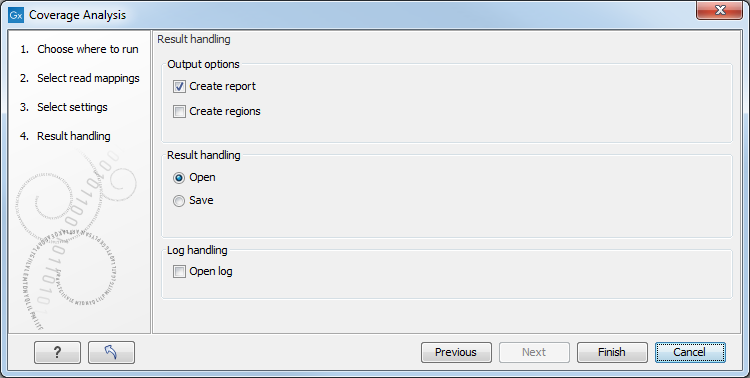
Figure 25.25: Specify the output.
Selecting the "Create report" will generate the report made of 2 tables (figure 25.26). The first one, called References, lists per chromosome the number of reads, their length, and how many signatures of unexpectedly low or high coverage was found in the mapping. The second table lists on 2 rows low and high coverage signatures found, as well as how many reads were used to calculate these signatures.
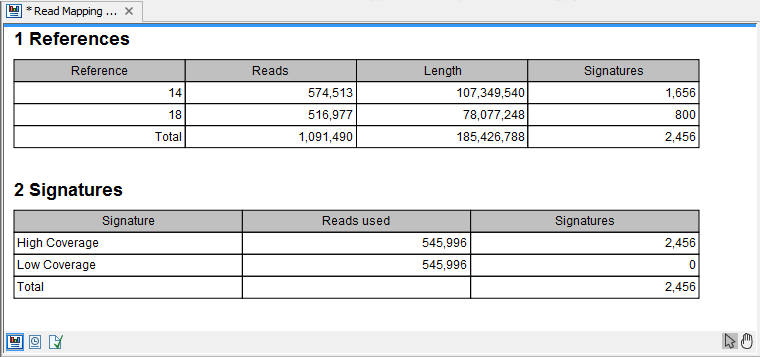
Figure 25.26: The report output.
Selecting the "Create regions" will generate the annotation track carrying the name of the original file followed by (COV). This file can be visualized as an annotation track or as a table depending on the users choice. The annotation table contains a row for each detected low or high coverage region, with information describing the location, the type and the p-value of the detected region. The p-value of a region is defined as the average of the p-values calculated for each of the positions in the region.
An example of a track output of the Coverage analysis tool is shown in figure 25.27.
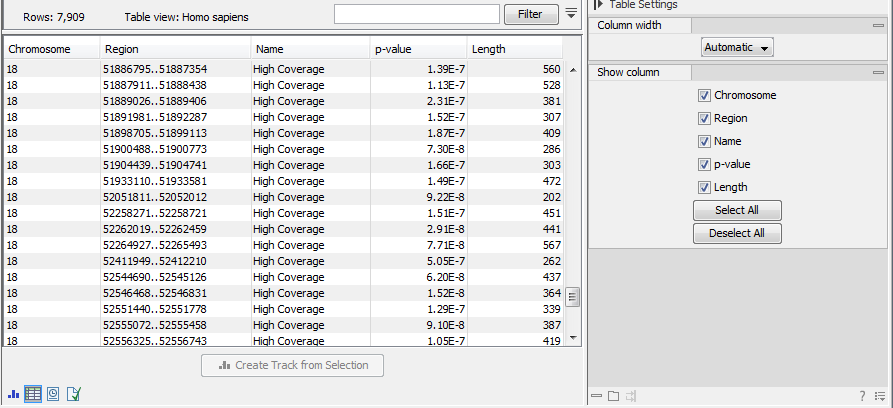
Figure 25.27: The table output with detailed information on each region.
The Coverage Analysis table includes the following columns (figure 25.27):
- Chromosome
- The name is taken from the reference sequence used for mapping
- Region
- The start and end position of this region on the reference sequence
- Name
- The type of annotation: high or low coverage
- P-Value
- The calculated significance p-value for this region
- Length
- The length of the region
For the visual inspection and comparison to known gene/transcripts or other kind of annotations, all region are also annotated on the read mapping.