Learning peak shapes
In order to learn a characteristic shape from ChIP-Seq data, the Transcription Factor ChIP-Seq tool
analyzes the genomic coverage of the reads.
For each read mapping, the 5' position of the reads mapping in the forward
strand and the 3' position of the reads mapping in the reverse strand are
extracted.
Those values are then normalized to create a coverage value for the forward and the reverse strand.
In order to learn the characteristic peak shape of ChIP-Seq data, the Transcription Factor ChIP-Seq tool
identifies a set of positive regions, i.e. regions with very apparent peaks.
Those regions are easy to find and are typically found by every peak-caller.
The Transcription Factor ChIP-Seq tool identifies these regions by finding areas with
very high coverage in the ChIP-Seq data.
The average shape of the positive regions of the NRSF transcription factor is
shown in for the forward and reverse strand in
figure 29.3.
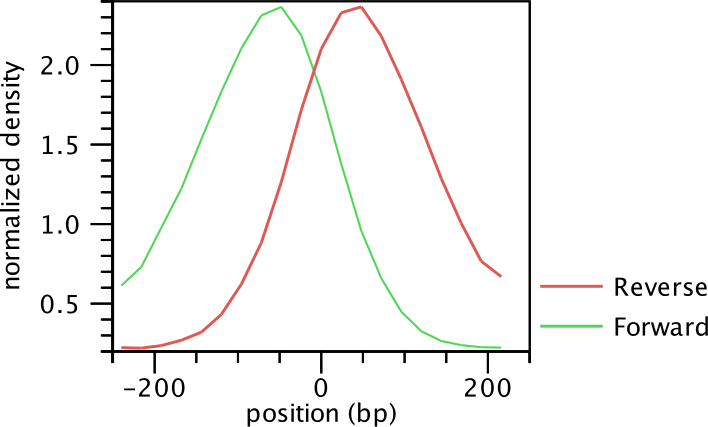
Figure 29.3: Average peak shape of the transcription factor NRSF.
Next, the Transcription Factor ChIP-Seq tool builds a filter, which can be used to identify genomic regions whose read coverage profile matches the characteristic peak shape and to determine the statistical significance of this match. In order to build such a filter, examples of positive (e.g. ChIP-Seq peaks) and negative (e.g. background noise, PCR artifacts) profiles are needed as input. The Transcription Factor ChIP-Seq tool uses regions with very high coverage in the experiment ChIP-Seq as positive examples. If control ChIP-Seq experiments are given, regions with high coverage in the control and low in the experimental ChIP-Seq data are used as negative examples, as they are probably originated from PCR artifacts. If there is no information to build a negative profile from, the profile is estimated from the sequencing noise.
Once the positive and negative regions have been identified, the Transcription Factor ChIP-Seq tool learns a filter that matches the average peak shape, which we term peak shape filter. The filter implemented is called Hotelling Observer and was chosen because it is the matched filter that maximizes the AUCROC (Area Under the Curve of the Receiver Operator Characteristic), one of the most widely used measures for algorithmic performance.
The Hotelling observer ![]() is defined as:
is defined as:
where
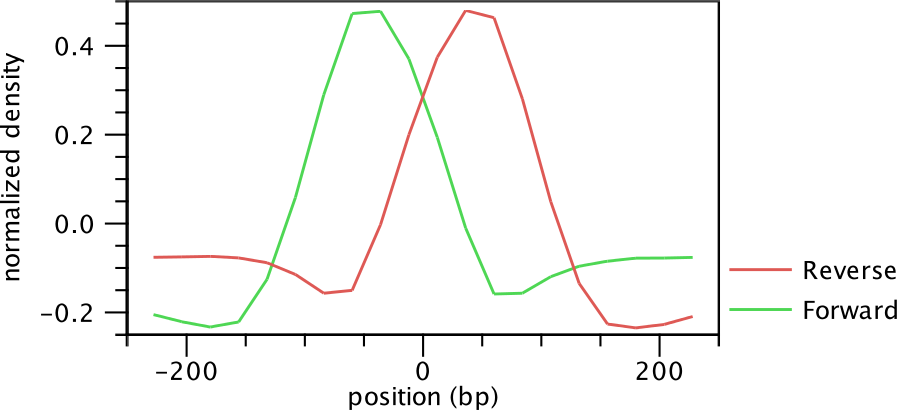
Figure 29.4: Peak shape filter for the transcription factor NRSF.