Reads track output from a read mapping
When the option "Create reads track" is chosen when running the tool "Map Reads to Reference", only the reads themselves will be saved. It is always possible to add information about the reference, consensus sequence or annotations later by creating a Track List. The main advantage of having the output of the read mapping process represented as a track is that this way it seamlessly integrates with other downstream analysis tools. So unless any specific functionality of the stand-alone read mapping is required, we recommend to use the tracks output for the additional flexibility in further analysis. Later it is possible to convert to and from tracks (see Converting data to tracks and back).
The side-panel functionality for viewing a read track and an annotation track is shown in Figure 24.18.
An aggregated Reads Track is shown in figure 24.14. The three blue shades shown in the Reads Track represent the aggregated mapped reads. This is displayed when the amount of data in view reaches the data aggregation setting. Within the specified aggregation bucket, from top to bottom the blue colors mean:
- The maximum coverage value (read count).
- The average coverage value.
- The minimum coverage value.
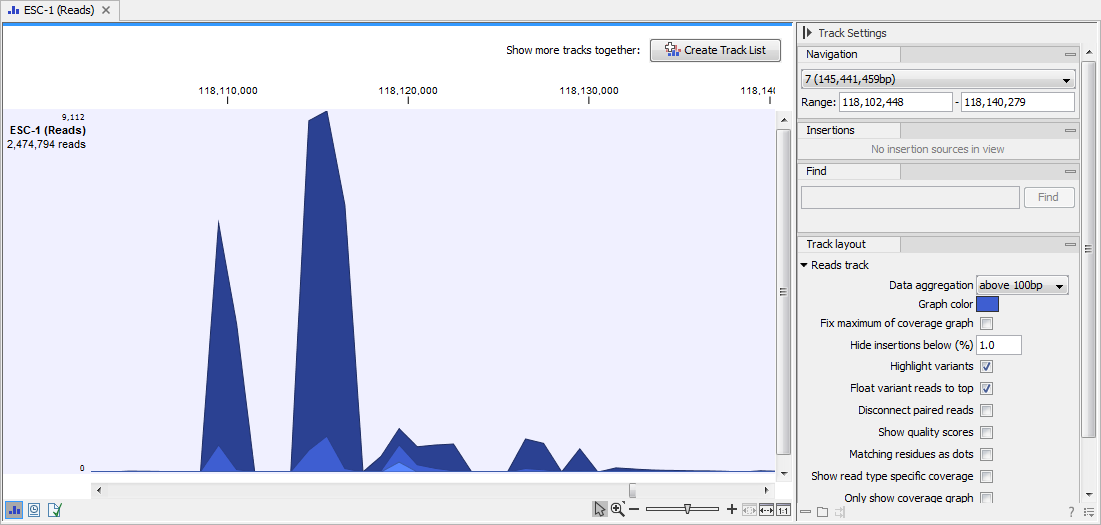
Figure 24.14: In the aggregated Reads Track, the three blue shades represent the aggregated mapped reads.
The data aggregation view is an alternative way of displaying a large amount of data (mapped reads) on the screen in order to shorten the data display time. This aggregated view allows you to navigate the view more smoothly and when used in combination with other tracks, this view can be used to get an overview of e.g. how many SNPs are located in a certain region.
In figure 24.15 we have zoomed in on a reads track (at the top showing the individual reads), with CDS and SNP annotations shown below.
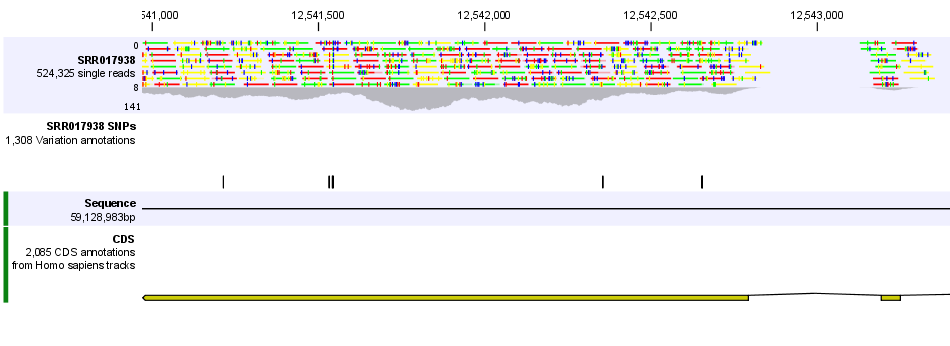
Figure 24.15: Zooming in on the tracks reveals details.
If you zoom in further the alignment of the reads and the reference sequence can be viewed at single nucleotide level (see figure 24.16).
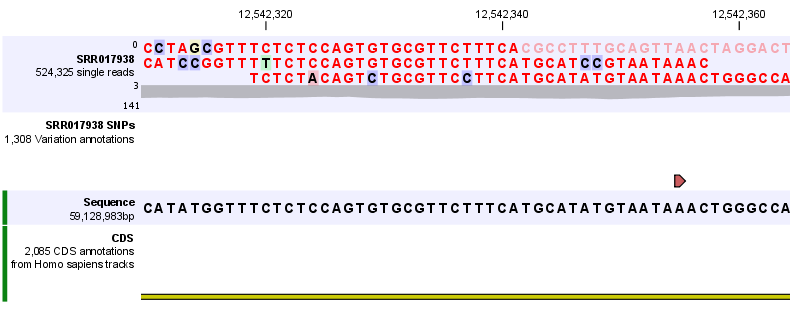
Figure 24.16: Zoom in to see the bases of the reads and the reference sequence.
In this case only three reads are visible. In order to see more reads, increase the height of the reads track by dragging down the lower part of the track with the mouse (Figure 24.17).
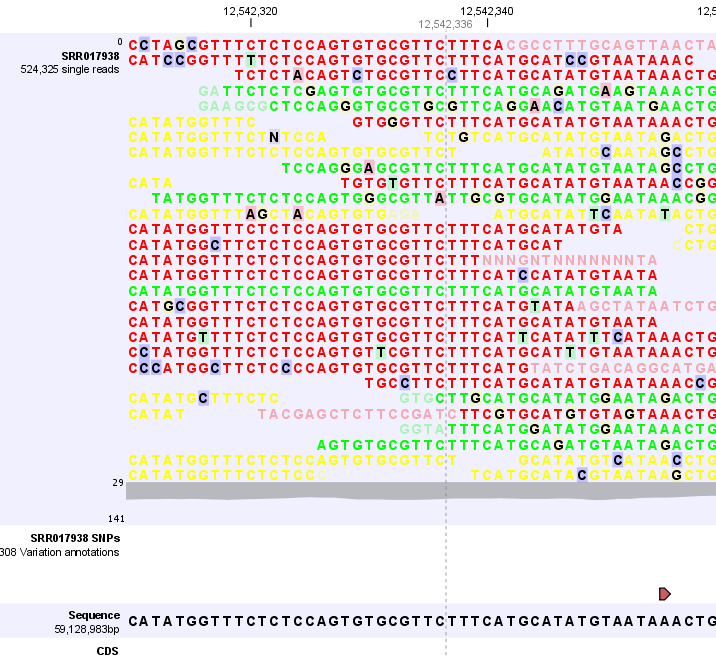
Figure 24.17: Adjusting the height of the track.
The options for the Side Panel vary depending on which track is shown in the View Area. In figure 24.18 an example is shown for a read mapping:
- Navigation.
- Gives information about which chromosome is currently shown. Below this, you can see the start and end positions of the shown region of the chromosome. The drop-down list can be used to jump to a different chromosome. It is also possible to jump to a new position. This can be done by typing in the start and end positions in the text fields. Thousands separators are supported. The selected region will automatically appear in the viewing area.
- Insertions.
- Only relevant for variant tracks.
- Find.
- Not relevant for reads tracks.
- Track layout.
- The options for the Track layout varies depending on which track type is shown. The options for a read track are:
- Data aggregation. Allows you to specify whether the information in the track should be shown in detail or whether you wish to aggregate data. By aggregating data you decrease the detail level but increase the speed of the data display process, which is of particular interest when working with big data sets. The threshold (in bp) for when data should be aggregated can be specified with the drop-down box. The threshold describes the unit (or "bucket") size in base pairs, above which the data will start being aggregated. The bucket size depends on the track length and the zoom level. Hence, a data aggregation threshold with a low value will only show details when zoomed in, whereas a high value means that you can see details even when zoomed out. Please note that when using the high values, it will take longer time to display the data on the screen. Figure 24.18 shows the options for a read track and an annotation track. The data aggregation settings can be adjusted for each displayed track type.
- Graph color. Makes it possible to change the graph color.
- Fix maximum of coverage graph. Specifies the maximum coverage to be shown on the y-axis and makes the coverage on individual read tracks directly comparable with each other. Applies across all of the read mapping tracks.
- Hide insertions below (%). Hides insertions where the percentage of reads containing insertions is below this value. To hide all insertions, set this value to 101.
- Highlight variants. Variants are highlighted
- Float variant reads to top. When checked, reads with variations will appear at the top of the view.
- Disconnect paired reads. Disconnects paired end reads.
- Show quality scores. Shows the quality score. Ticking this option makes it possible to adjust the colors of the residues based on their quality scores. A quality score of 20 is used as default and will show all residues with a quality score of 20 or below in a blue color. Residues with quality scores above 20 will have colors that correspond to the selected color code. In this case residues with high quality scores will be shown in reddish colors. Clicking once on the color bar makes it possible to adjust the colors. Double clicking on the slider makes it possible to adjust the quality score limits. In cases where no quality scores are available, blue (the color normally used for residues with a low quality score) is used as default color for such residues.
- Matching residues as dots. Replaces matching residues with dots, only variants are shown in letters.
- Show read type specific coverage. When enabled, the coverage graph that summarizes those reads that could not be explicitly shown is now replaced by one coverage graph for each read type found in the Reads track. The read types graphs are made transparent so that the overlap can be visible when graphs are rendered on top of each other. This option can for instance be used for easy and visual comparison of the strand specific coverage.
- Only show coverage graph. When enabled, only the coverage graph is shown and no reads are shown.
- Highlight reverse paired reads. When enabled, read pairs with reverse orientation are highlighted with a light blue color.
When working with other track types such as gene tracks, other options are available:
- Labels. Controls where in relation to the annotation features the labels will be shown, i.e. Flag places a label at the beginning of the gene, and above the feature graphics as shown in figure 24.19.
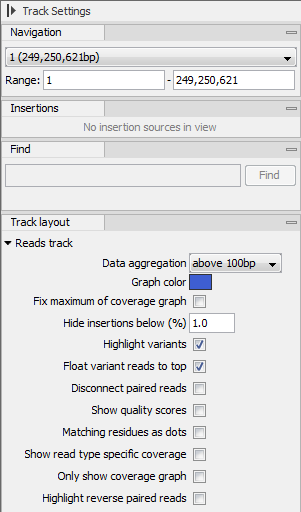
Figure 24.18: The Side Panel for reads tracks.
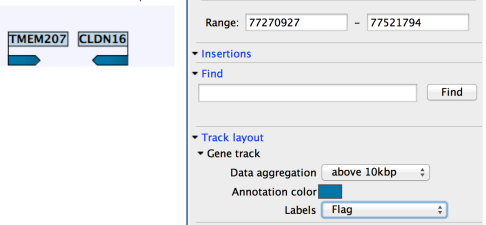
Figure 24.19: The Side Panel for annotation tracks.