The output of Annotate Single Cell Reads
Annotate Single Cell Reads produces the following outputs:
- A Sequence List (
 ) of 'annotated reads'.
- Optionally, a Sequence List () of 'unmatched reads' that did not match the configured options.
- Optionally, a Report (
 ) containing various summaries.
The annotated reads
The 'annotated reads' contain just the 'Sequence' part of the read structure for the input reads that matched the configured options. These reads are suitable for use in several tools, see Annotate Single Cell Reads. Note that the output reads are sorted by their cell barcode, UMI and hashtag, if used, so they will appear shuffled compared to the input.
The table view of the sequence list (see https://resources.qiagenbioinformatics.com/manuals/clcgenomicsworkbench/current/index.php?manual=Table_view_sequence_lists.html) contains the annotations added to the reads.
The barcode in the 'Cell barcode' column is formed by 'Cell barcode' tags in the read structure and/or the barcode extracted from names, joined by a '-'.
Barcodes that are corrected (see Barcode correction) and/or translated (see 'Multiome ATAC' and 'Parse Biosciences' in Read structure) contain the final barcode under 'Cell barcode', and the uncorrected and untranslated barcode under 'Original barcode'.
The unmatched reads
The 'unmatched reads' contain the input reads that did not match the configured options:
- The reads did not match the Read structure. Typically these reads are too short. If longer reads are present, it may be worth verifying if the read structure includes a variable length tag.
- The read names did not match the Read name structure.
- The cell barcodes for the reads were discarded because they are not on the whitelist.
The report
The report includes the following sections:
- Summary
This section contains information about the number of:
- Input, annotated and unmatched reads.
- Distinct cell barcodes, as well as hashtags, if used. If multiple barcode components are defined, the total number of barcodes reflects the final joined cell barcodes.
- Barcode correction
This section is present if barcode correction was used. It contains, for each barcode component, the number of barcodes that were:
- Identified.
- Corrected.
- Discarded, if a whitelist was used.
- Retained.
- Barcode ranks
A plot ranking the cell barcodes in decreasing order of the number of reads (figure 6.4). The number of cells present in the data can be approximated by the location of a sharp fall in the plot.
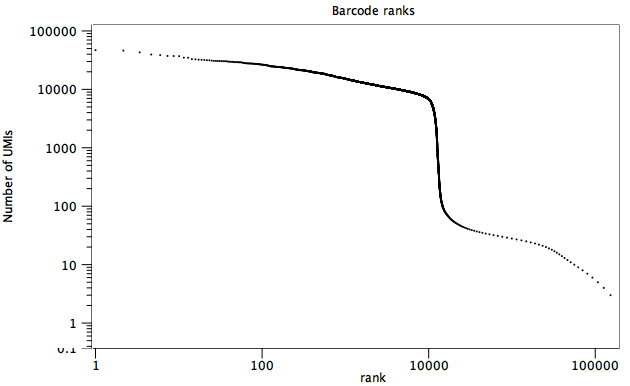
Figure 6.4: A barcode ranks plot. A sharp transition from an average of a bit less than 10,000 reads to less than 100 reads per barcode is seen at x = 5,000, suggesting that there are approximately 5,000 cells in the data.- Nucleotide counts
Plots showing the distributions of different nucleotides at each position for the tags extracted using the Read structure (cell barcode, UMI, hashtag) for the 'annotated reads'.
The distributions for cell barcodes and UMIs are both expected to be roughly uniform, while the distribution for hashtags varies depending on the number of distinct hashtags in the data. The distribution becomes more uniform with more hashtags, but if only a few hashtags are expected, for example when the hashtag represents the sample, the distribution is likely to be skewed and should reflect the known expected hashtags.
For simplicity, the remainder of this section will talk about 'barcodes', but the description is equally true for UMIs.
Typically, barcodes are randomly generated, or else designed to be very different from each other, such that all nucleotides are observed at each barcode position, and in approximately equal amounts. Errors may be detected when the barcode plots do not show this behavior, such as in figure 6.5, where position 1 in the barcode is mostly 'A', position 2 is mostly 'A', position 3 is mostly 'G' etc. It appears that one barcode contains almost all the reads in the sample. In this case, the cell barcode part of the read structure has been misconfigured to read an adapter with sequence 'AAGCAGTGGT'. The same plot with the correct read structure is shown in figure 6.6.
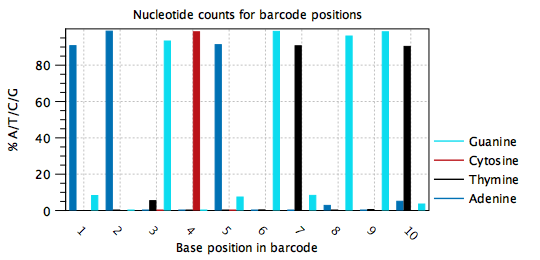
Figure 6.5: Nucleotide counts plot for a misconfigured barcode. One barcode with sequence 'AAGCAGTGGT' is present in most of the reads. In this case the barcode was misconfigured to be part of an adapter.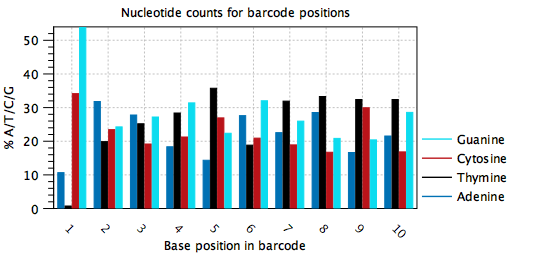
Figure 6.6: Nucleotide counts plot for the same data as in figure 6.5. All nucleotides are seen at all positions of the barcode with comparable frequencies, except for at position 1. This dataset is from a 96-well protocol where the barcodes for each well are known in advance and the skewed nucleotide distribution at position 1 is as expected.