Create Phase Portrait Plot
Create Phase Portrait Plot is available from:
Tools | Single Cell Analysis (![]() ) | Gene Expression (
) | Gene Expression (![]() ) | Velocity Analysis (
) | Velocity Analysis (![]() ) | Create Phase Portrait Plot (
) | Create Phase Portrait Plot (![]() )
)
The tool takes a Velocity Matrix (![]() ) as input and produces a Phase Portrait Plot (
) as input and produces a Phase Portrait Plot (![]() ) containing phase portraits for all genes with imputed spliced and unspliced counts (see The output of Single Cell Velocity Analysis for details). The estimated velocities and inferred dynamics can also be visualized for the velocity genes.
) containing phase portraits for all genes with imputed spliced and unspliced counts (see The output of Single Cell Velocity Analysis for details). The estimated velocities and inferred dynamics can also be visualized for the velocity genes.
An example output is shown in figure 10.3.
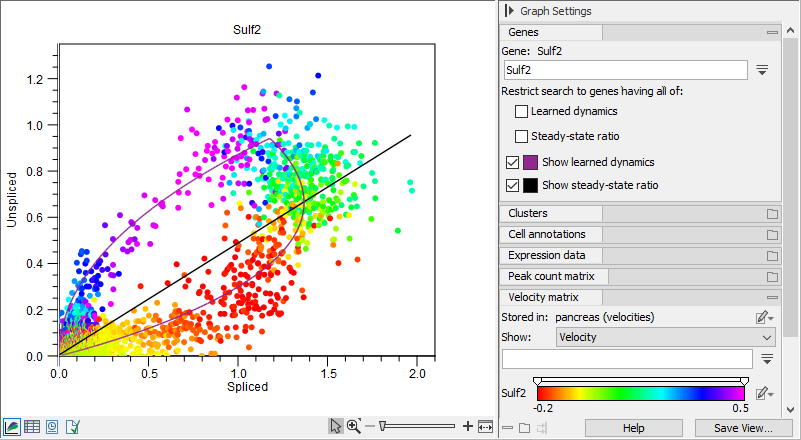
Figure 10.3: A phase portrait with inferred dynamics for the pancreas data set [Bastidas-Ponce et al., 2019] built-in scVelo [Bergen et al., 2020].
The gene to be shown in the phase portrait can be chosen under the `Genes' group at the top right of the Side Panel. When a new gene is selected, the cells are automatically colored by the velocity component for that gene, if available.
The gene search can be limited to only showing the genes for which velocity has been estimated, by selecting `Learned dynamics' and/or `Steady-state ratio' under `Restrict search to genes having all of:'. Hit space in the search field to list all genes, subject to these restrictions (if any).
The inferred dynamics, if available, and steady-state ratio can be shown or hidden by toggling the `Show learned dynamics' and `Show steady-state ratio'.
When changing to the table (![]() ) view of the plot, all genes for which a phase portrait is available will be listed per row. Choosing one row in this table will update the plot to show the phase portrait for the selected gene.
) view of the plot, all genes for which a phase portrait is available will be listed per row. Choosing one row in this table will update the plot to show the phase portrait for the selected gene.
Using a Phase Portrait Plot, various aspects of the data can be visualized, see Single cell low-dimensional plots functionality for details. Note that it is not possible to edit clusters or launch tools using Phase Portrait Plots.