The output of QC for Single Cell
The tool produces the following outputs:
- An Expression Matrix (
 ) / (
) / ( ) containing only the barcodes that passed all filters.
- Optionally, a Cell Annotations (
 ) element containing the different QC metrics used by the filters for the barcodes that passed all filters. Using this Cell Annotations, the barcodes can be colored in a Dimensionality Reduction Plot using the QC metrics.
- Optionally, a Report (
 ), summarizing the filters applied and providing diagnostic plots for each type of filter, as detailed below. The report contains information separately for each sample: summary tables contain one row per sample (figure 7.11), while plots are added per sample.
Empty droplets filter
Note that for droplet-based protocols, each droplet is assigned one barcode and these terms can be used interchangeably.
If the Empty droplets filter was enabled, the report contains the following information.
The report first shows the barcode rank plot, as seen in figure 7.9.
![]()
Figure 7.9: Barcode rank plot: log-log plot of the total number of reads for each barcode vs the rank of the barcode, in decreasing order of the number of reads. The barcodes are colored according to whether they are empty droplets containing only ambient RNA (Ambient, black) or retained as cells because they contain a high number of reads (Retained, green). When "Identify cells from the remaining droplets" is checked, remaining barcodes are shown in blue and are tested for being empty droplets (top). Otherwise, these barcodes are shown in red and are removed as empty droplets (bottom).
A summary of the empty droplet filtering and the identified cells is then shown, see figure 7.10 and figure 7.11.
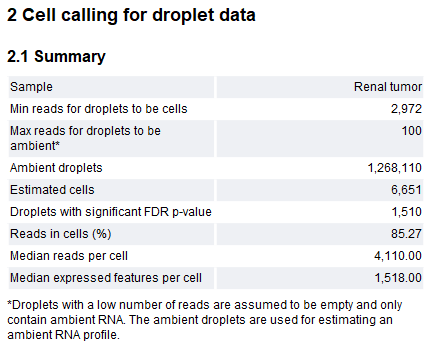
Figure 7.10: Table summarizing the performed empty droplets filter and identified cells. "Droplets with significant FDR p-value" is reported only when "Identify cells from the remaining droplets" is checked.
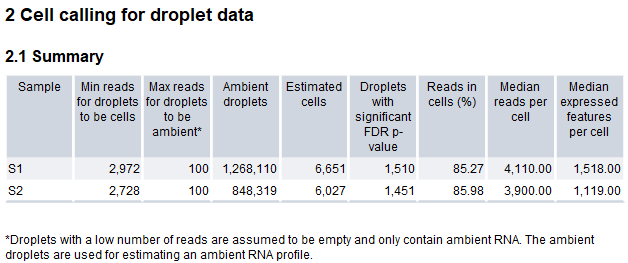
Figure 7.11: Table summarizing the performed empty droplets filter and identified cells, for input matrix containing two samples.
If any automatic threshold was used (see Empty droplets filter), the barcode rank plot and summary table can indicate if this was successful or not. If any of the thresholds are not appropriate, they can be changed as detailed in Empty droplets filter.
When Identify cells from the remaining droplets is checked, the p-values are simulation-based. The number of simulations to be performed is calculated automatically based on the FDR threshold. The report shows the p-value distribution for the ambient droplets. This is expected to be roughly uniformly distributed. Peaks close to 0 indicate that the assumption is invalid and the value for considering barcodes as being empty droplets should be reduced (see Empty droplets filter).
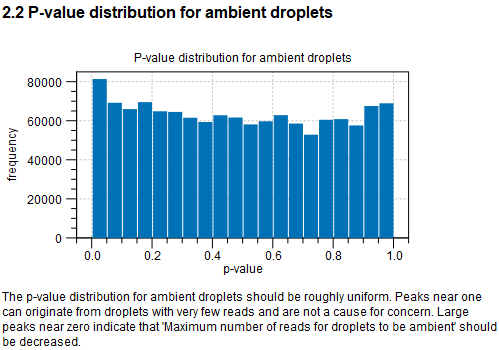
Figure 7.12: Histogram of the p-values calculated for the barcodes from which the ambient RNA profile is built.
Count-based and extra-chromosomal filters
If the Empty droplets filter was not enabled, the report first shows the barcode rank plot, as seen in figure 7.13.
![]()
Figure 7.13: Barcode rank plot: log-log plot of the total number of reads for each barcode vs the rank of the barcode, in decreasing order of the number of reads. The barcodes are colored according to whether they are removed (red) or retained (blue), as determined by the number of reads filter.
The report then lists a summary regarding the performed Count-based filters and Extra-chromosomal filters, as shown in figure 7.14.
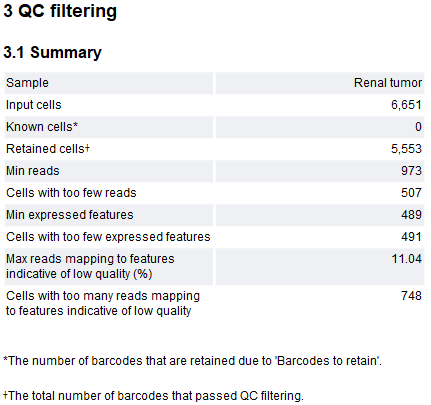
Figure 7.14: Table summarizing the performed count-based and extra-chromosomal filters.
Following are histograms of all QC metrics, regardless of whether they have been used for filtering or not. If filtering was enabled, the histograms indicate the threshold used, see figure 7.15. When this threshold is calculated automatically (see Count-based and extra-chromosomal filters), the histograms can indicate if the threshold is appropriate or not.
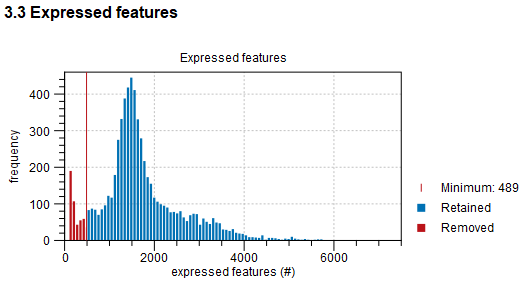
Figure 7.15: Histogram of the number of expressed features for all barcodes.
If the features indicative of low quality filter is enabled, barcodes with too many reads mapped to these features are removed. However, high quality cells can be highly metabolically active, leading to the incorrect removal of barcodes. The report contains plots showing the relations between the percentage of reads mapped to features indicative of low quality and the other QC metrics, where barcodes that might have been incorrectly removed are highlighted (figure 7.16). The highlighted barcodes are identified as having extreme values for the QC metrics, using an automatic threshold calculated in a similar manner to the approach described in Automatic thresholds. See Choosing barcodes to retain on how to specify barcodes that should not be removed.
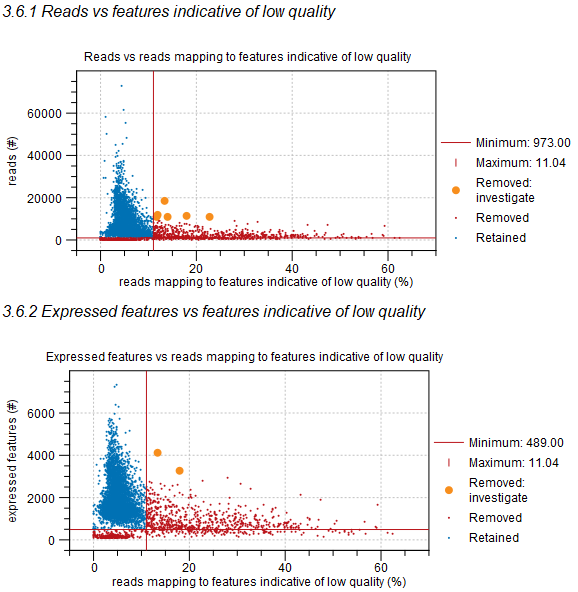
Figure 7.16: The percentage of reads mapped to features indicative of low quality vs the total number of reads (top) and expressed features (bottom). Barcodes in red have been removed and those in blue have been retained. The thresholds for removing barcodes are shown as horizontal and vertical red lines. Barcodes highlighted in orange have been removed, but might correspond to high quality cells that are highly metabolically active that should be retained.
Doublets filter
If the Doublets filter was enabled, the report contains the following information:
- A summary regarding the performed filter and the identified cells (figure 7.17).
- A histogram showing the doublet scores (figure 7.18), which can indicate if doublet filtering was successful.
- Relations between the doublet score and number of reads and expressed features (figure 7.19). Typically, barcodes with a high number of reads and/or expressed features are more likely to be removed as doublets.
These diagnostic plots can serve as a guide in adjusting the options for the doublet filter.
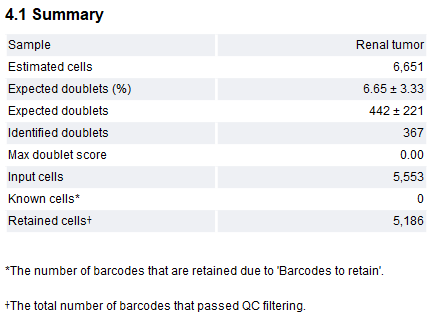
Figure 7.17: Table summarizing the performed doublets filter and identified cells.
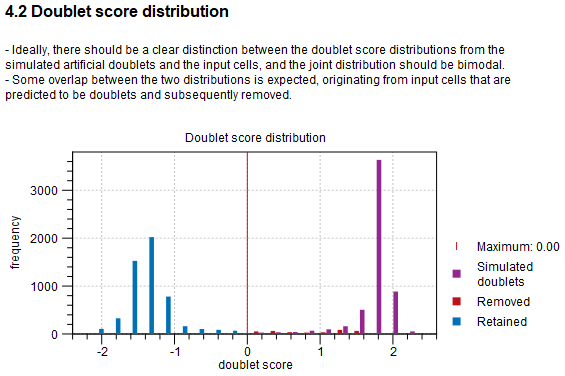
Figure 7.18: Histogram of the doublet score for all barcodes and simulated artificial doublets. The threshold for removing barcodes is shown as a vertical red line.
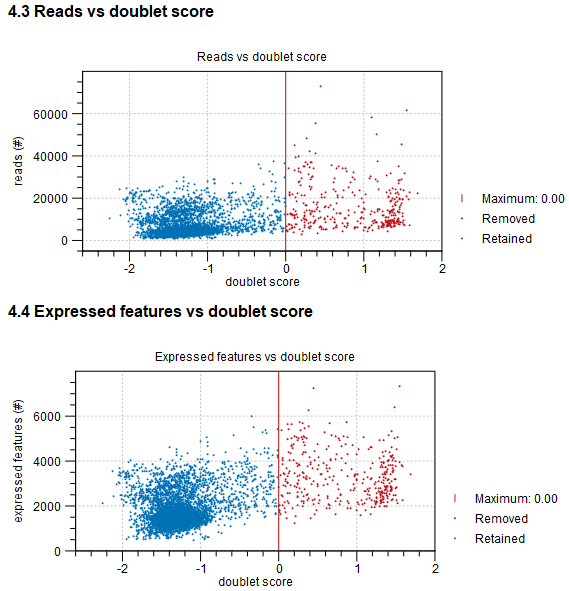
Figure 7.19: The doublet score vs the total number of reads (top) and expressed features (bottom). Barcodes in red have been removed and those in blue have been retained. The threshold for removing barcodes is shown as vertical red lines.