Launching of Create Heat Map for Cell Abundance
By choosing `Create Heat Map for Cell Abundance' from the low-dimensional plot right-click menu (see figure 17.4), the tool Create Heat Map for Cell Abundance can be started (see Create Heat Map for Cell Abundance). The dialog is automatically filled in with the relevant information from the plot (see figure 17.31).
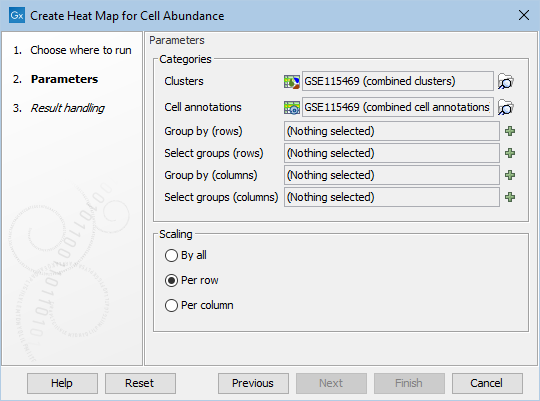
Figure 17.31: Dialog for Create Heat Map for Cell Abundance (see section Create Heat Map for Cell Abundance) when started from the plot. The clusters and annotations that are associated with the plot are automatically filled in. Note that `Group by' and `Scaling' need to be configured to obtain the desired analysis.