Single Cell Velocity Analysis
Single Cell Velocity Analysis estimates velocities for studying cellular dynamics. It takes an Expression Matrix with spliced and unspliced counts (Single Cell Velocity Analysis is available from:
Tools | Single Cell Analysis (![]() ) | Gene Expression (
) | Gene Expression (![]() ) | Velocity Analysis (
) | Velocity Analysis (![]() ) | Single Cell Velocity Analysis (
) | Single Cell Velocity Analysis (![]() )
)
The tool offers options to run dimensionality reduction or feature selection prior to velocity estimation. To perform feature selection through highly variable genes (HVGs), the data has to be normalized first with Normalize Single Cell Data. When HVGs are used, velocity is estimated only for these genes. This can greatly speed up the calculations. We recommend using HVGs whenever possible. Note that top velocity genes are not necessarily top HVGs. The default value of 2,000 is a good starting point - a too small value can lead to missing important velocity genes, while a too high value will diminish the computation gain. For details on dimensionality reduction or feature selection, please see Feature selection and dimensionality reduction.
The following additional options are available (figure 10.2):
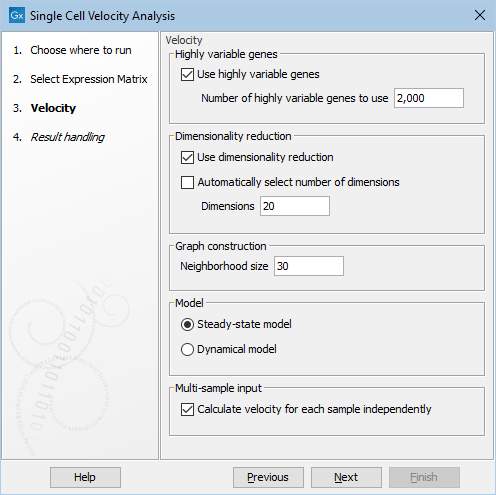
Figure 10.2: Options for Single Cell Velocity Analysis.
- Neighborhood size. The number of cells `k' used in the k-nearest neighbor graph for imputing spliced and unspliced counts. This determines the granularity of the imputation.
- Model. Two models are available to estimate velocities:
- Steady-state model: infers a steady-state ratio of unspliced to spliced mRNA levels, and determines the velocities as deviations from this ratio [La Manno et al., 2018]. It is fast but can be less accurate.
- Dynamical model: performs a likelihood-based inference of the full splicing kinetics and generalizes RNA velocity estimation to transient systems. Unlike the steady-state model, it is robust to non-observed steady-states [Bergen et al., 2020], but is much slower.
See The velocity estimation algorithm for details.
- Calculate velocity for each sample independently. If multiple samples are present in the input and this is enabled, the k-nearest neighbor graph, normalization and imputation (see The velocity estimation algorithm for details) will be performed for each sample independently, while the remaining velocity estimation will be performed using all the cells jointly. Otherwise, all cells are used jointly throughout the entire algorithm. We recommend running with inputs containing just one sample, and caution should be used otherwise when interpreting the output, see discussion below.
|
Multi-sample input: There are no well-established approaches for joint batch correction of spliced and unspliced counts. We recommend caution when analyzing a matrix containing multiple samples. If the matrix is batch corrected using Normalize Single Cell Data, then the correction is only applied to the total gene expression, which is used for k-nearest neighbor graph construction, and not to the spliced and unspliced counts, which are used for velocity estimation. See [Bergen et al., 2021] for a discussion on batch correction for velocity estimation. |
|
Single nucleus RNA sequencing (snRNA-Seq): Velocity estimation has been developed for scRNA-Seq data and it is yet to be determined how well the method works for snRNA-Seq, where the assumptions of the model might not hold [Bergen et al., 2021]. We recommend caution when analyzing and interpreting the results for this type of data. |
Subsections