The Expression Matrix element
Expression Matrix (
An Expression Matrix (![]() ) contains one expression value for each cell and feature.
) contains one expression value for each cell and feature.
An Expression Matrix with spliced and unspliced counts (![]() ) contains multiple expression values:
) contains multiple expression values:
- The overall expression, which is determined by Include intronic reads in total expression, see Import Expression Matrix and Single Cell RNA-Seq Analysis.
- The amount of spliced and unspliced mRNA.
Both Expression Matrix (![]() )/ (
)/ (![]() ) element types contain table views centered around features (
) element types contain table views centered around features (![]() ) and cells (
) and cells (![]() ). Feature expressions for individual cells can be viewed in one of these two tables, described below. See https://resources.qiagenbioinformatics.com/manuals/clcgenomicsworkbench/current/index.php?manual=Working_with_tables.html for general information on working with tables.
). Feature expressions for individual cells can be viewed in one of these two tables, described below. See https://resources.qiagenbioinformatics.com/manuals/clcgenomicsworkbench/current/index.php?manual=Working_with_tables.html for general information on working with tables.
Feature Table
The Feature Table (![]() ) for an Expression Matrix (
) for an Expression Matrix (![]() )/ (
)/ (![]() ) contains one row for each feature, and has the following columns:
) contains one row for each feature, and has the following columns:
- Name. The name of the feature.
- Id. A feature identifier. The identifier is either determined upon import, see Import Expression Matrix, or from the gene/mRNA track used when running Single Cell RNA-Seq Analysis, see Single Cell RNA-Seq Analysis.
- Type. The feature type.
- Chromosome. The chromosome that the feature is on.
- Region. The region that the feature spans.
The Feature Table for an Expression Matrix (![]() ) additionally contains the following columns:
) additionally contains the following columns:
- Min/Max/Avg raw counts. The minimum/maximum/average feature expression across all cells.
- Cells. The number of cells that express the feature.
The Feature Table for an Expression Matrix with spliced and unspliced counts (![]() ) instead contains the following columns:
) instead contains the following columns:
- Min/Max/Avg raw counts/spliced/unspliced. The minimum/maximum/average feature expression across all cells, considering the overall/spliced/unspliced expression.
- Cells w/ raw counts/spliced/unspliced. The number of cells that express the feature, considering the overall/spliced/unspliced expression.
Clicking on a row opens a separate table, listing the cells expressing the feature (figure 7.30).
To create a new element from a row selection in the table, use the Create Matrix from Selection option in the right-click menu. Cells that express at least one of the selected features are included.
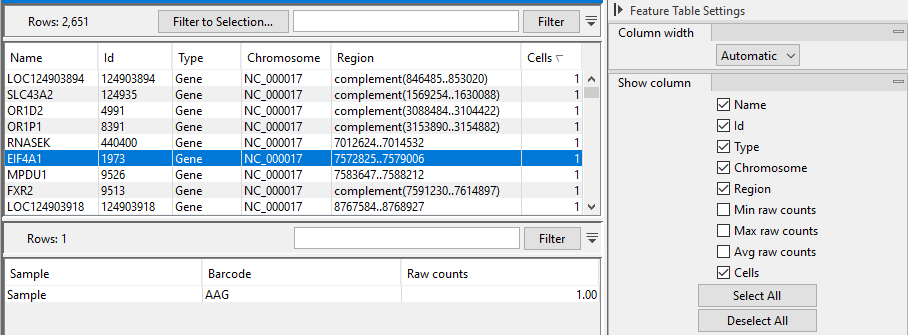
Figure 7.30: Feature Table for an Expression Matrix. One feature expressed by one cell is selected. The table at the bottom shows the cell and its expression level.
Cell Table
The Cell Table (![]() ) for an Expression Matrix (
) for an Expression Matrix (![]() )/ (
)/ (![]() ) contains one row for each cell, and has the following columns:
) contains one row for each cell, and has the following columns:
- Sample. The sample that the cell is from.
- Barcode. The cell barcode.
The Cell Table for an Expression Matrix (![]() ) additionally contains the following column:
) additionally contains the following column:
- Nonzero values. The number of features expressed by the cell.
The Cell Table for an Expression Matrix with spliced and unspliced counts (![]() ) instead contains the following columns:
) instead contains the following columns:
- Nonzero (Raw counts/Spliced/Unspliced). The number of features expressed by the cell, considering the overall/spliced/unspliced expression.
Clicking on a row opens a separate table, listing the features expressed by the cell (figure 7.31).
To create a new element from a row selection in the table, use the Create Matrix from Selection option in the right-click menu.
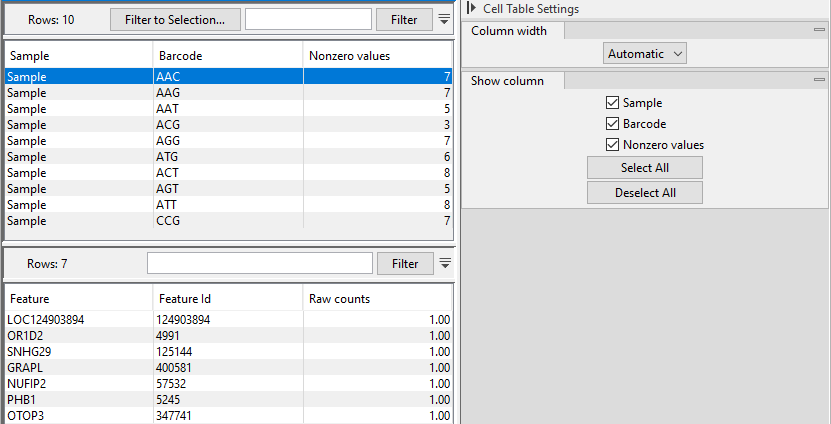
Figure 7.31: Cell Table for an Expression Matrix. One cell expressing seven features is selected. The table at the bottom shows the features and their expression levels.