Velocity Analysis
RNA velocity is a high-dimensional vector and a powerful approach to predict the future state of the individual cells on a timescale of hours, from the static snapshot provided by scRNA-Seq. This can help analyze time-resolved phenomena such as embryogenesis or tissue regeneration [La Manno et al., 2018,Bergen et al., 2020]. Visualizing this high-dimensional vector as arrows in a Dimensionality Reduction Plot provides an easy interpretation of the moving cell system (figure 10.1). Arrows show the direction and speed of movement of each cell, which can reveal differences between near-terminal cells, where arrows are short, and transient cells, where arrows are longer.
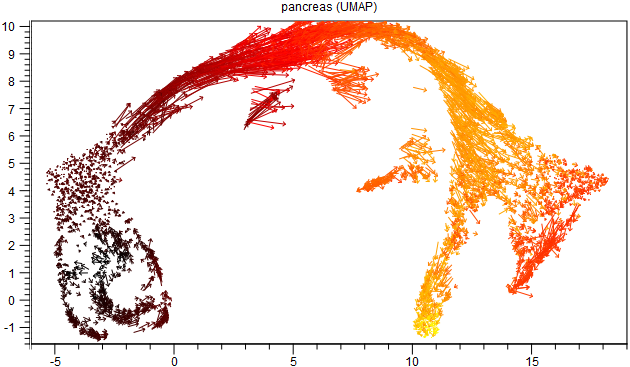
Figure 10.1: UMAP plot of the pancreas data set [Bastidas-Ponce et al., 2019] built-in scVelo [Bergen et al., 2020]. Arrows show the direction and speed of movement of an individual cell. The real time cells experience as they differentiate is approximated by the latent time, shown here in the 0 (black) to 1 (yellow) range.
Subsections
- Single Cell Velocity Analysis
- Differential Velocity for Single Cell
- Score Velocity Genes
- Create Phase Portrait Plot
- The Velocity Matrix element