Cell Clonotypes Sankey plot
The Sankey plot view (- shows how the segments of different types form the clonotypes for a given chain, when "Show column per" is set to "Grouping property" in the Side Panel (figure 13.12);
- compares clonotypes frequencies across samples, when "Show column per" is set to "Sample" in the Side Panel (figure 13.14). This option is available only for Cell Clonotypes containing more than one sample.
Note that only primary clonotypes (see Primary and secondary clonotypes) are included in the Sankey plot. For visualizing secondary clonotypes, run first Filter Cell Clonotypes with `Multiple clonotypes' set to `Retain secondary', see Filter Cell Clonotypes for details.
To keep the plot size manageable, it is recommended to filter the clonotypes using the Filter Cell Clonotypes tool.
Grouping property
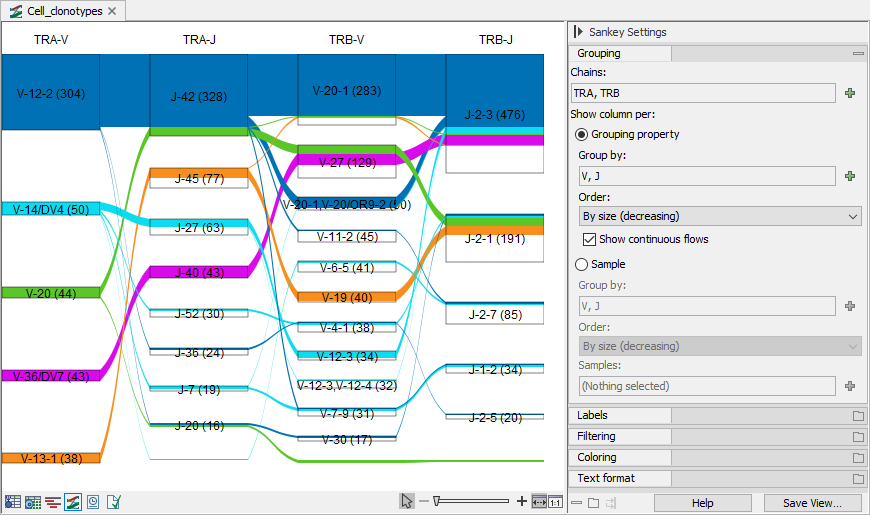
Figure 13.12: Sankey plot for the TRA and TRB chains showing the V and J segments. Numbers in brackets show the total barcode count. Flows show how many barcodes have clonotypes with the specific chain and segment combinations. The plot is restricted to showing only the most common 5 TRA-V segment. The box for TRA-J-45 contains a white region because there are barcodes with TRA-J-45 that have a TRA-V segment that is different than those present in the plot.
For each selected segment type, the plot has a column that contains boxes for each segment. The box height reflects the total number of cells containing clonotypes with the given segment. The boxes are connected with flows. The color of a flow indicates the element where the flow starts. "Flows start at" can be used to change the start column, by default the leftmost. "Show continuous flows" controls the type of the flows:
- If not ticked, there are flows between boxes in consecutive columns for clonotypes having segments corresponding to the boxes. The height of the flow indicates the total number of cells for these clonotypes.
- If ticked, the flows start from the fixed column defined by "Flows start at". When the flow starts at the leftmost column, flows between boxes in the first two columns reflect clonotypes with segments corresponding to the two boxes. Flows between boxes in the second and third column reflect clonotypes corresponding to the boxes in both the first, second and third column, and so on.
"Show continuous flows" has no effect when there are less than three columns.
Boxes can be removed from the plot by using the options under "Filtering" in the Side Panel (figure 13.12). The plot will show only boxes for the selected segments and the boxes to which the selected segments have a flow. If multiple filters are used, boxes are subject to all the restrictions (figure 13.13).
The columns and their order can be changed by using the options under "Group by" in the Side Panel. The CDR3 amino acid sequences can also be shown, see figure 13.13.
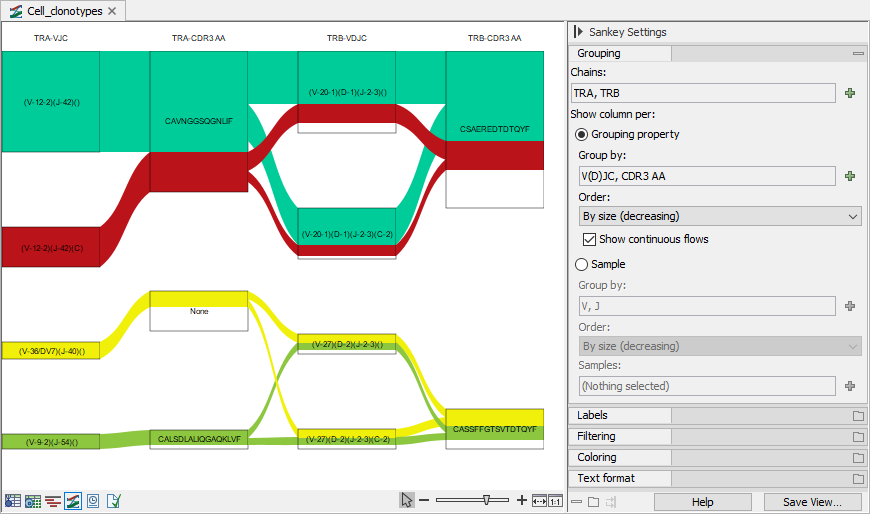
Figure 13.13: Sankey plot for the TRA and TRB chains showing the V(D)JC segments and CDR3. The plot is filtered to show only the most common 5 TRA and TRB V(D)JC segments. Note that only 4 boxes for TRA-VJC and TRB-VDJC are present in the plot, because there are no barcodes containing both of the missing TRA-VJC and TRB-VDJC. Clonotypes can have CDR3s that are out of frame and are hence missing a CDR3 AA. These are shown in the None box.
Sample
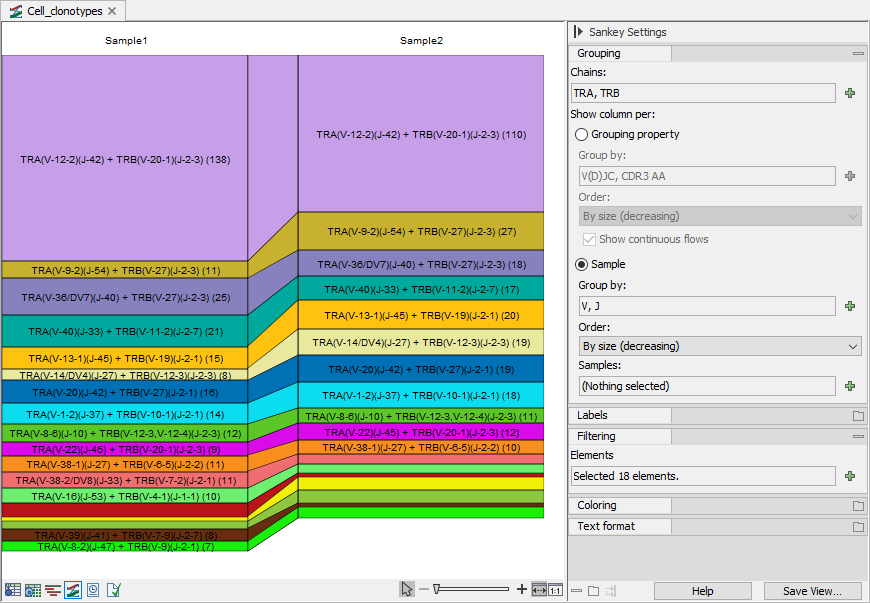
Figure 13.14: Sankey plot for the TRA and TRB chains showing the clonotypes count with specific V and J segments, compared across samples. Number in brackets show the total barcode count.
For each selected sample, the plot has a column that contains boxes for each group of clonotypes (hereafter referred to as simply clonotypes) with the selected properties. The properties, such as the segment type or the CDR3 amino acid sequence, are selected from the Side Panel under "Group by".
The height of a box indicates the frequency of the clonotypes in the sample. The frequency is defined as the number of barcodes with the specific clonotype, divided by the total number of barcodes found in the sample.