The Spatial Transcriptomics Plot element
A Spatial Transcriptomics Plot (
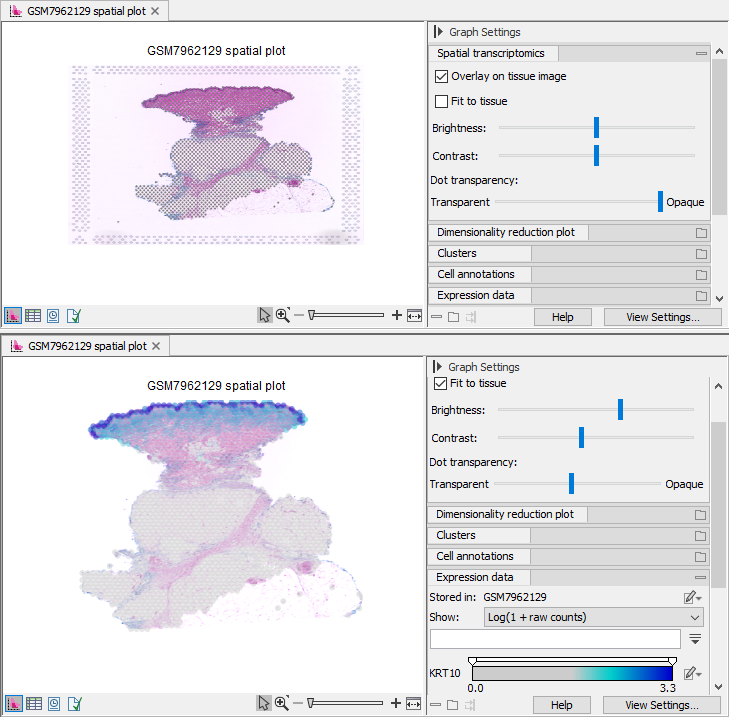
Figure 11.1: A Spatial Transcriptomics Plot of the GSM7962129 data from the Gene Expression Omnibus repository. Top: Default view. Bottom: The image is fit to the tissue, and brightness, contrast, saturation and dot transparency are adjusted. The barcodes are colored using the expression of KRT10.
Using a Spatial Transcriptomics Plot, various aspects of the data can be visualized, cells can be manually annotated and various tools can be started using the information selected in the plot, see Single cell low-dimensional plots functionality for details.
When Overlay on image is checked, the tissue image, if available, is shown and the barcodes are displayed on top of it. If the image contains the fiducial markers, Fit to tissue can be used to clip the image to only show the tissue where barcodes have been detected. Using the sliders, the brightness, contrast, saturation and transparency of the image, as well as the transparency of the dots, can be controlled.
Linking to a Dimensionality Reduction Plot
A Spatial Transcriptomics Plot can be linked to a Dimensionality Reduction Plot, such that the options and selections are mirrored in both plots. For example:
- The source of colors in the Spatial Transcriptomics Plot is controlled from the Side Panel of the Dimensionality Reduction Plot.
- Lasso selection of barcodes in one plot is reflected in the other.
|
The barcodes in the Dimensionality Reduction Plot and those in the Spatial Transcriptomics Plot need to have the same sample name. Ideally, it should be ensured that these share the sample name as a first step when importing the Spatial Transcriptomics Plot element (see Import Spatial Transcriptomics). If this has not been done, the sample name can be updated using Update Single Cell Sample Name. |
To link the plots (figure 11.2):
- Open the Dimensionality Reduction Plot, if it is not already open. To visualize the plots side by side, use a split view, see https://resources.qiagenbioinformatics.com/manuals/clcgenomicsworkbench/current/index.php?manual=Arrange_views_in_View_Area.html for details.
- Associate the Dimensionality Reduction Plot to the Spatial Transcriptomics Plot by dragging the Dimensionality Reduction Plot into the 'Dimensionality reduction plot' Side Panel group of the Spatial Transcriptomics Plot. The association can be saved by saving the changes to the Spatial Transcriptomics Plot.
- Check Link to plot to link the two plots.
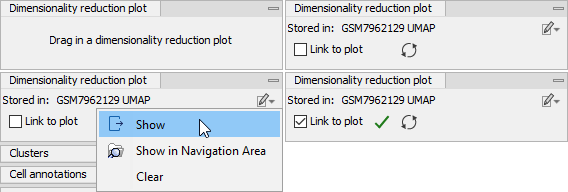
Figure 11.2: A Dimensionality Reduction Plot can be associated to a Spatial Transcriptomics Plot. Top left: Initial view. Top right: A plot has been dragged into the Side Panel and is now associated. Bottom left: An associated plot can be opened from the menu in the top right corner of the Side Panel group. Bottom right: The link is active.
On subsequent uses of the Spatial Transcriptomics Plot, the Dimensionality Reduction Plot can be opened from the Side Panel (figure 11.2).
The link is active if 'Link to plot' is checked and enabled (figure 11.2). When there is an active link, most of the Side Panel groups for the Spatial Transcriptomics Plot are disabled and the coloring is based on the options chosen in the Dimensionality Reduction Plot (figure 11.3).
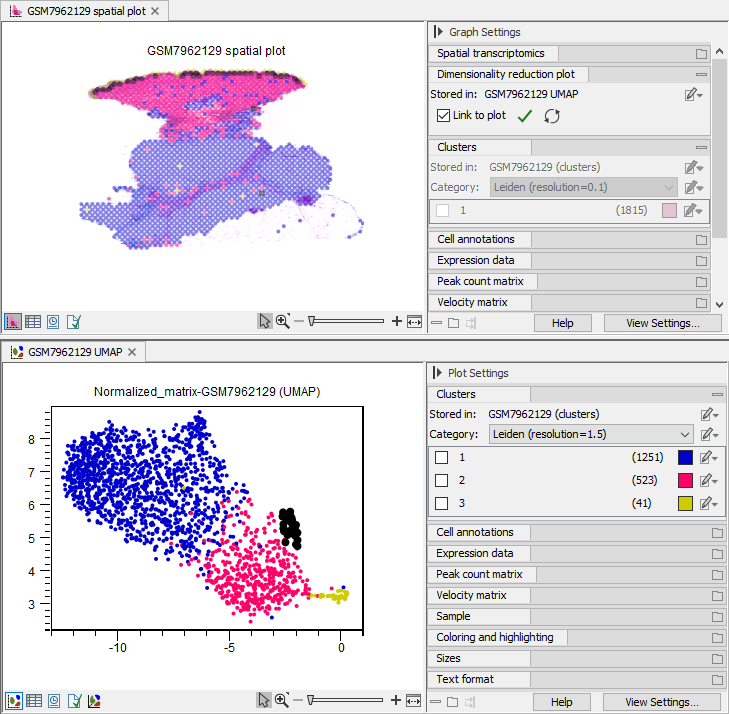
Figure 11.3: The source of colors in the Spatial Transcriptomics Plot is controlled from the Side Panel of the Dimensionality Reduction Plot. Lasso selections in either plot is reflected in both plots.
When the active link is disabled by unchecking Link to plot, the Side Panel groups for the Spatial Transcriptomics Plot are enabled again and the coloring is reverted to the state before the link was activated.