Extract to Table
By choosing `Extract to Table' from the low-dimensional plot right-click menu (see figure 17.4), a table can be created, with the relevant information for the corresponding selected cells (see figures 17.28 and 17.29).
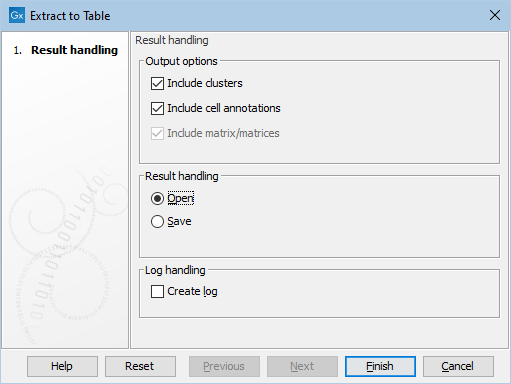
Figure 17.28: Dialog for Extract to Table. The Output options allow choosing which available information will be included in the resulting plot.
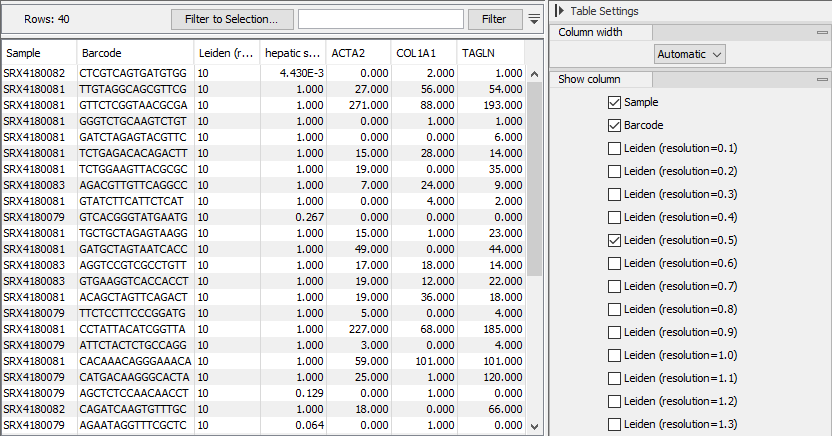
Figure 17.29: The output of Extract to Table. Only the `Sample', `Barcode', `Leiden (resolution=0.5)' cluster, probability of `cardiomyocytes', and expression of `Myl2' columns are shown, as selected in the Side Panel.