Statistical comparison tracks
The Differential Expression for RNA-Seq tool will output one or more statistical comparison tracks or tables. The statistical comparison table offers the same functionality than the track, except for the track view.
An example of a statistical comparison track is shown in figure 28.30. Statistical comparison tracks make it possible to show differential expression data alongside other kinds of tracks in a genomic context.
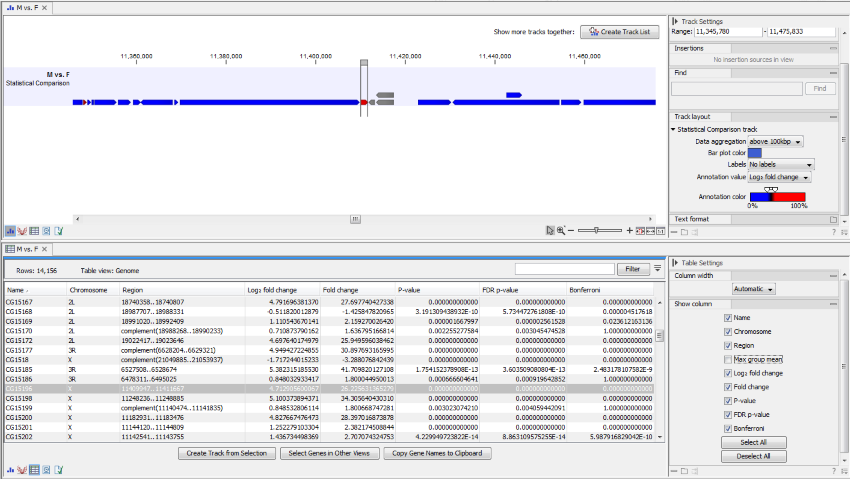
Figure 28.30: Statistical comparison track view.
In particular, the Fold Change value will tell you how expression levels in group 2 are relative to that in group 1.
- If expression values in group 2 are twice as large as in group 1, the fold change will be +2.
- If expression values in group 1 are twice as large as in group 2, the fold change will be -2.
The track layout of the statistical comparison track can be customized as follows:
- Data aggregation Allows you to specify whether the information in the track should be shown in detail or whether you wish to aggregate data. By aggregating data you decrease the detail level, but increase the speed of the data display process, which is of particular interest when working with big data sets. The threshold (in bp) for when data should be aggregated can be specified with the drop-down box. The threshold describes the unit (or "bucket") size in base pairs, above which the data will start being aggregated. The bucket size depends on the track length and the zoom level. Hence, a data aggregation threshold with a low value will only show details when zoomed in, whereas a high value means that you can see details even when zoomed out. Please note that when using the high values, it will take longer time to display the data on the screen.
- Bar plot color Selects the color of aggregated data.
- Labels Determines where the gene name should be shown.
- Annotation value The value that is graphically shown in detail view:
- Max group means For each group in the statistical comparison, the average RPKM is calculated. This value is the maximum of the average RPKM's.
- -log2 fold change The logarithmic fold change.
- Fold change The (signed) fold change. Genes/transcripts that are not observed in any sample have undefined fold changes and are reported as NaN (not a number).
- P-value Standard p-value. Genes/transcripts that are not observed in any sample have undefined p-values and are reported as NaN (not a number).
- FDR p-value The false discovery rate corrected p-value.
- Bonferroni The Bonferroni corrected p-value.
- Annotation color Determines how the annotation value is mapped onto a color.
The expression track table view has the following options:
- The "Filter to selection" only displays pre-selected rows in the table.
- The "Create track from Selection" will create a Track using selected rows.
- The "Select Genes in Other Views" button finds and selects the currently selected genes and transcripts in all other open expression track table views.
- The "Copy Gene Names to Clipboard" button copies the currently selected gene names to the clipboard.