Create Expression Browser
The Create Expression Browser tool makes it possible to inspect gene and transcript expression level counts, annotations and statistics for many samples at the same time.
To run the tool:
Toolbox | RNA-Seq Analysis | Create Expression Browser
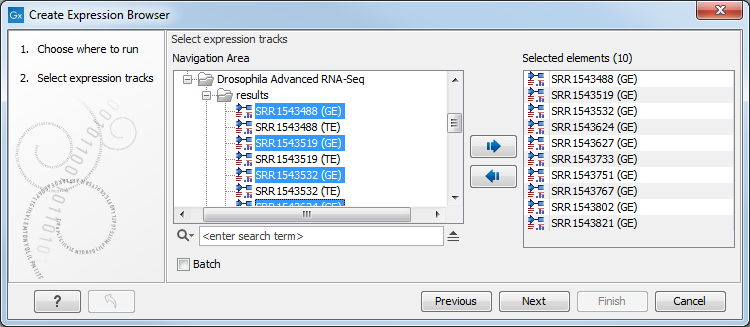
Select a number of expression tracks (![]() ), either Gene level (GE) or Transcript level Expression (TE) tracks but not a combination of both, and click Next (see figure 28.36).
), either Gene level (GE) or Transcript level Expression (TE) tracks but not a combination of both, and click Next (see figure 28.36).

Figure 28.36: Select expression tracks, either GE or TE.
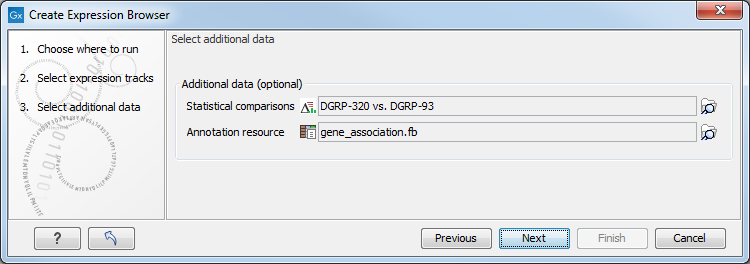
In the second wizard dialog (see figure 28.37), you can decide to add one or more statistical comparisons or an annotation source.

Figure 28.37: It is optional to provide statistical comparisons and annotation resources.
Statistical comparisons are generated by the Differential Expression for RNA-Seq tool. You can only choose a comparison that was generated by the same kind of expression tracks as the ones you selected in the previous step. This means that when you want to create an expression browser for GE expression levels, you can only input in the second optional step a statistical comparison generated using GE tracks as well.
Annotation resources can be obtained from different sources:
- In the majority of cases, annotations are obtained from Gene Ontology consortium at http://geneontology.org/page/download-annotations. Download the *.gz file of your choice from the website on to your computer, and import it in the workbench using the Standard Import tool.
- You may have your own annotation data in a spreadsheet. Learn how to import such files here: Generic expression and annotation data file formats.
- Annotations can be generated by the "Blast2GO PRO" plugin (see http://www.qiagenbioinformatics.com/plugins/blast2go-pro/ for more information).
- Some annotations for human, mouse and rat are also bundled together with Reference Data Sets.
Subsections
