Create Fold Change Track
The Create Fold Change Track tool can be used to compare RNA expression levels in two samples (e.g., matched tumor and normal samples).
After RNA-seq analysis, the resulting expression tracks can be compared using the Create Fold Change Track tool. For each gene or transcript, this tool will compute the ratio of the expression value in the case track to the expression value of the same gene in the control track. The tool enables filtering on the basis of fold-changes as well as expression values. This can give a quick first indication of possible differentially expressed genes or transcripts between two RNA-seq samples. For a more detailed and statistically robust analysis, we recommend running a Statistical Analysis tool in the CLC Genomics Workbench.
The tool for creating a fold-change track can be found here:
Toolbox | Legacy Tools | Create Fold Change Track (![]() )
)
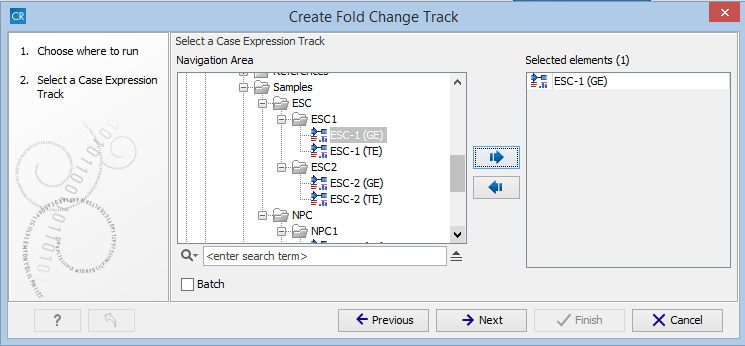
After starting the Create Fold Change Track tool, select the expression track corresponding to the case sample in the input dialog, as shown in figure 33.14, and click on the button labeled Next.

Figure 33.14: Choosing the case expression track for the Create Fold Change Track tool.
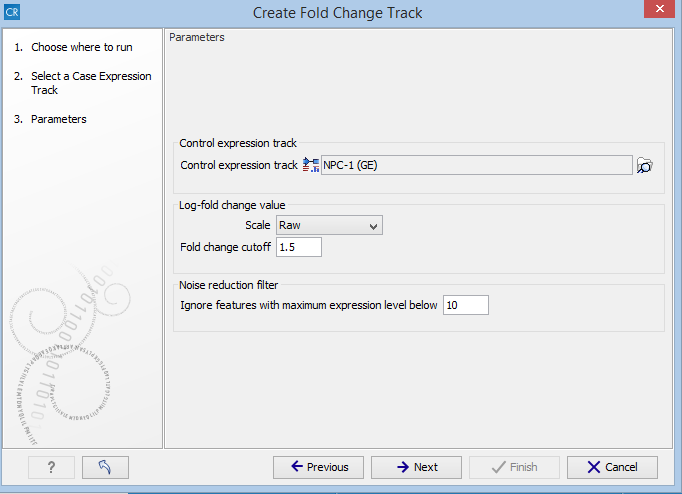
You are now presented with the wizard step shown in figure 33.15 where you can set the following input parameters:

Figure 33.15: Setting the input parameters for the Create Fold Change Track tool.
- Control expression track At the top of the wizard, a control expression track must be chosen. The control expression track will be used as the reference in creating the fold-change track.
- Log fold change value In the middle of the wizard, the parameters relating to the reported fold-change values can be specified.
- Scale Determines on what scale the fold-changes should be reported and interpreted:
- Raw The fold-changes will be reported as a direct ratio:

- Log-2 The fold-changes will be reported as log-2 values:

- Log-10 The fold-changes will be reported as log-10 values:

- Natural logarithm The fold-changes will be reported as log-
 values:

- Raw The fold-changes will be reported as a direct ratio:
- Fold-change cutoff Enables filtering in the results based on fold-changes. Note that the value entered into the fold-change cutoff field will be interpreted according to the scale specified in the scale parameter. For example, if the expression level of a gene is 100 in the case sample and 200 in a control sample, then a cutoff of 1.5 with the scale parameter set to Raw will not result in the gene being filtered on the basis of fold-changes, and the gene will appear in the final results. However, if the scale parameter is set to Log10, the gene will be filtered and will not appear in the final results. To include all genes or transcripts in the output without filtering on the basis of fold-changes, enter 0 in this field (this will work for any value specified for the scale parameter).
- Scale Determines on what scale the fold-changes should be reported and interpreted:
- Noise reduction filter A second level of filtering is possible based on absolute expression levels. The rationale behind this filtering is that seemingly very large fold-changes can occur by chance if the expression levels are very low in both samples, creating a false-positive noise in the resulting fold-change track. Therefore, it is desirable to require a certain level of expression for a gene in at least one of the samples. This can be specified using the Ignore features with maximum expression level below parameter.
- Ignore features with maximum expression level below The value entered in this field corresponds to the minimum expression level required in either the case or the control track, in order for the gene or transcript to appear in the results. If the expression level does not exceed this value in either the case or the control sample, the gene or transcript will be filtered out from the final results. Entering a value of 0 for this parameter will not filter any genes or transcripts based on absolute expression levels.
The Create Fold Change Track tool will produce an annotation track, including the genes or transcripts that were not filtered out based on the filtering criteria. Each feature in this track is annotated with the following information:
- Fold-change Represents the fold-change according to the specified scale. A positive value indicates that the expression level was higher in the case. A negative value indicates that the expression level was higher in the control. If Raw was specified for the scale parameter, a value of 0 represents no difference. If a logarithm-based value was specified for the scale parameter, a value of 1 represents no difference.
- Difference Represents the difference in expressions. A positive value indicates that the expression level was higher in the case. A negative value indicates the expression level was higher in the control.
- Maximum expression Represents the larger of the expression values observed in the case and the control samples.
- Expression (case) Gives the expression value in the case sample
- Expression (control) Gives the expression value in the control sample
As is the case with all annotation tracks in the CLC Genomics Workbench, it is possible to sort and filter the results based on any of the above values, and to create track lists for further analysis of the results.
