Normalization and chromosome analysis
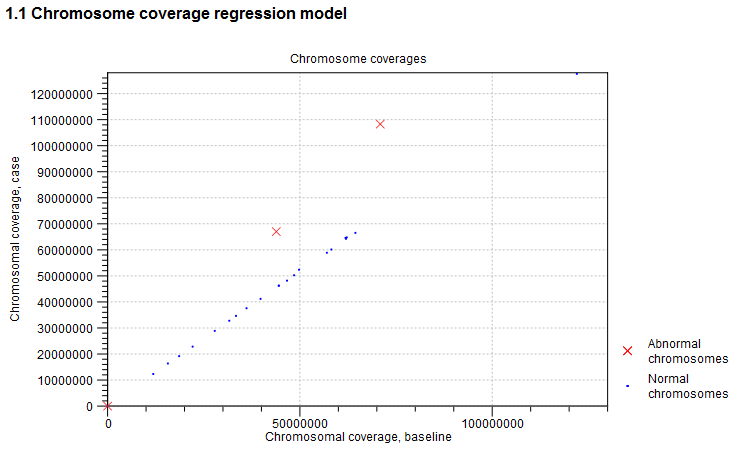
This section of the report is related to the first step of the Copy Number Variant Detection tool, where the chromosome-level coverages are analyzed to detect any outliers. The total coverages of the case chromosomes are plotted against the total coverages of the baseline, and the detected outliers are indicated. Chromosome coverages identified as disproportionate are marked with red crosses (see figure 26.31).

Figure 26.31: An example graph showing the coverages of the chromosomes in the case versus the baseline. In this example, three chromosomes are marked as abnormal. Two of these chromosomes are significantly amplified, and log-ratios of coverages of many targets on these chromosome are significantly higher than for targets on other chromosomes. The third outlier chromosome had zero coverage in both the case and the baseline.
The graph is followed by a table, where the detailed chromosome coverages are shown after normalization. Chromosomes with disproportionate coverage and chromosomes without any targets are marked in the 'Comment' column. These chromosomes are the ones marked with red crosses in the graph in section 1.1. of the algorithm report, and these chromosomes were not used in the coverage normalization step.
