Merge and Estimate Alpha and Beta diversities
The Merge and Estimate Alpha and Beta diversities workflow requires several abundance tables as input file. The first tool of the workflow is the Merge Abundance Tables. The output is a single merged abundance table that will be used as input for two additional tools, the Alpha diversity tool and the Beta diversity tool. Running this workflow will therefore give three outputs: a diversity report for the alpha diversity, a PCoA for the beta diversity and a merged abundance table.
To run the tool, go to: Metagenomics (![]() ) | Taxonomic Analysis (
) | Taxonomic Analysis (![]() ) | Workflows (
) | Workflows (![]() ) | Merge and Estimate Alpha and Beta diversities (
) | Merge and Estimate Alpha and Beta diversities (![]() ).
).
In the first step, select several abundance tables (figure 6.37).
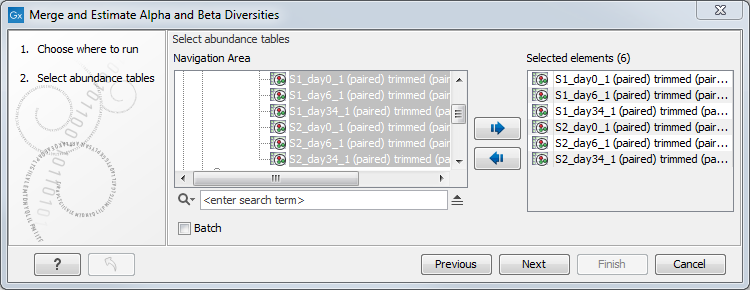
Figure 6.37: Select abundance tables.
In the second and third steps, you can choose parameters for the Alpha Diversity and for the Beta Diversity analyses. The parameters are described in Alpha Diversity and Beta Diversity.
The Merge and Estimate Alpha and Beta Diversities workflow generates the results seen in figure 6.38.
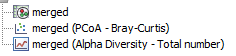
Figure 6.38: Results from the Merge and Estimate Alpha and Beta Diversities workflow.
Please refer to Alpha Diversity and Beta Diversity to learn more about interpreting these results.