How to run the Type among Multiple Species (legacy) workflow
To run the workflow for one or more samples containing multiple species, go to
Legacy Tools (![]() ) | Type among Multiple Species (legacy) (
) | Type among Multiple Species (legacy) (![]() )
)
- Specify the sample(s) or folder(s) of samples you would like to type (figure 24.33) and click Next. Remember that if you select several items, they will be run as batch units.
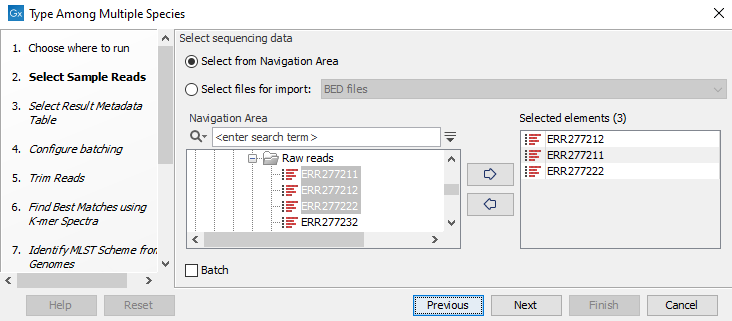
Figure 24.33: Select the reads from the sample(s) you would like to type. - Specify the Result Metadata Table you want to use (figure 24.34) and click Next.
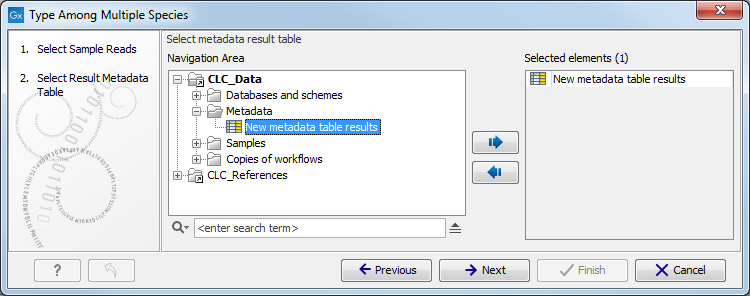
Figure 24.34: Select the metadata table you would like to use. - Define batch units using organisation of input data to create one run per input or use a metadata table to define batch units. Click Next.
- The next wizard window gives you an overview of the samples present in the selected folder(s). Choose which of these samples you want to analyze in case you are not interested in analyzing all the samples from a particular folder (figure 24.35).
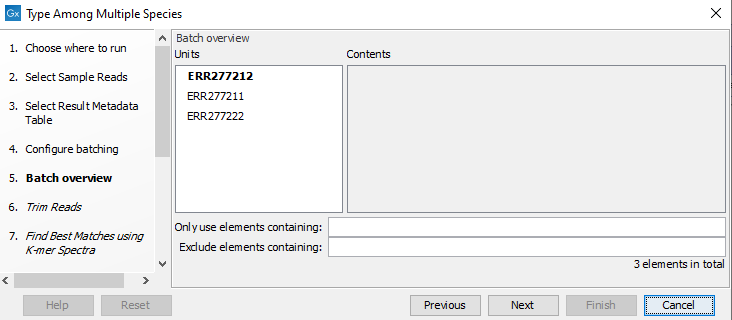
Figure 24.35: Choose which of the samples present in the selected folder(s) you want to analyze. - You can specify a trim adapter list and set up parameters if you would like to trim your sequences from adapters. Specifying a trim adapter list is optional but recommended to ensure the highest quality data for your typing analysis (figure 24.36). Learn about trim adapter lists at http://resources.qiagenbioinformatics.com/manuals/clcgenomicsworkbench/current/index.php?manual=Trim_adapter_list.html.
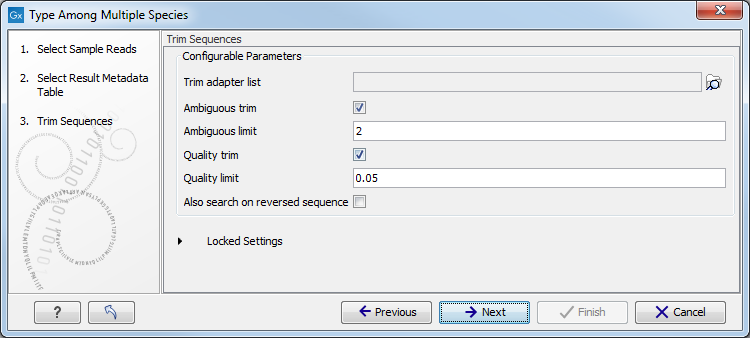
Figure 24.36: You can choose to trim adapter sequences from your sequencing reads.The parameters that can be set are:
- Ambiguous trim: if checked, this option trims the sequence ends based on the presence of ambiguous nucleotides (typically N).
- Ambiguous limit: defines the maximal number of ambiguous nucleotides allowed in the sequence after trimming.
- Quality trim: if checked, and if the sequence files contain quality scores from a base-caller algorithm, this information can be used for trimming sequence ends.
- Quality limit: defines the minimal value of the Phred score for which bases will not be trimmed.
- Also search on reversed sequence: the adapter sequences will also be searched on reverse sequences.
- Choose the species-specific references to be used by the Find Best Matches using K-mer Spectra tool (figure 24.37). The list can be a fully customized list, the downloaded bacterial genomes from NCBI list (see section 18.1.1) or a subset of it. Click Next.
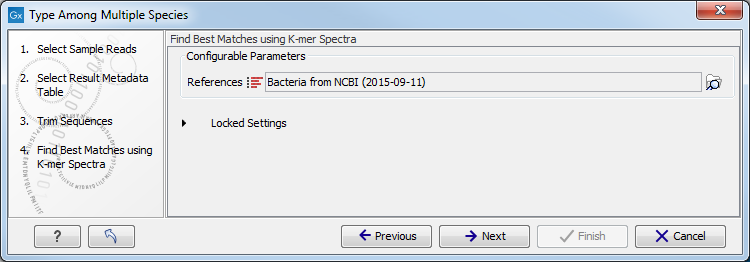
Figure 24.37: Specify the references for the Find Best Matches using K-mer Spectra tool. - Specify MLST schemes to be used for the Identify MLST Scheme from Genomes tool so they correspond to corresponding to the chosen reference list(s) (figure 24.38).
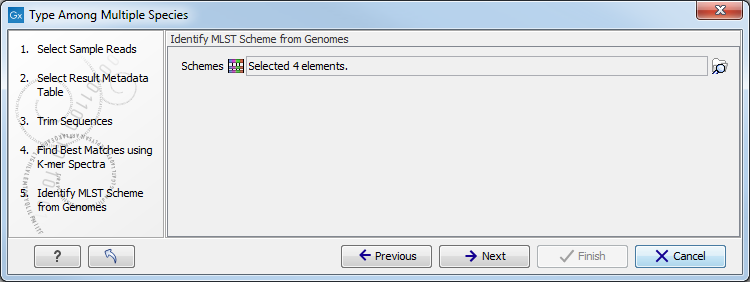
Figure 24.38: Specify the schemes that best describe your sample(s). - Specify the resistance database (figure 24.39) and set the parameters for the Find Resistance with Nucleotide DB tool.
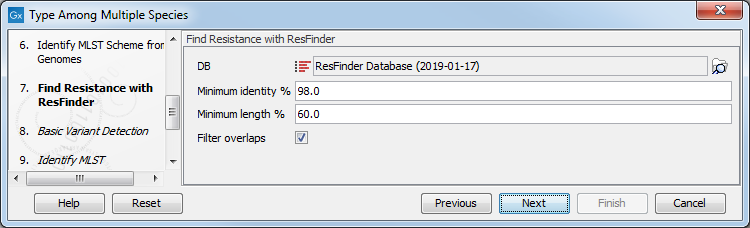
Figure 24.39: Specify the resistance database to be used for the Find Resistance with Nucleotide DB tool.The parameters that can be set are:
- Minimum Identity %: is the threshold for the minimum percentage of nucleotides that are identical between the best matching resistance gene in the database and the corresponding sequence in the genome.
- Minimum Length %: reflect the percentage of the total resistance gene length that a sequence must overlap a resistance gene to count as a hit for that gene. Here represented as a percentage of the total resistance gene length.
- Filter overlaps: will perform extra filtering of results per contig, where one hit is contained by the other with a preference for the hit with the higher number of aligned nucleotides (length * identity).
Click Next.
- Specify the parameters for the Basic Variant Detection tool (figure 24.40) before clicking Next.
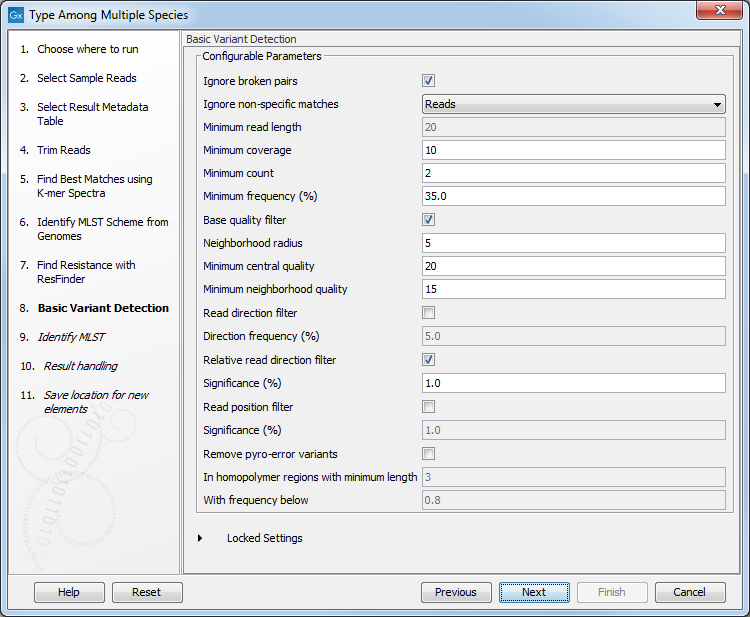
Figure 24.40: Specify the parameters to be used for the Basic Variant Detection tool.The parameters that can be set are:
- Ignore broken pairs: You can choose to ignore broken pairs by clicking this option.
- Ignore non-specific matches: You can choose to ignore non-specific matches between reads, regions or to not ignore them at all.
- Minimum read length: Only variants in reads longer than this size are called.
- Minimum coverage: Only variants in regions covered by at least this many reads are called.
- Minimum count: Only variants that are present in at least this many reads are called.
- Minimum frequency %: Only variants that are present at least at the specified frequency (calculated as count/coverage) are called.
- Base quality filter: The base quality filter can be used to ignore the reads whose nucleotide at the potential variant position is of dubious quality.
- Neighborhood radius: Determine how far away from the current variant the quality assessment should extend.
- Minimum central quality: Reads whose central base has a quality below the specified value will be ignored. This parameter does not apply to deletions since there is no "central base" in these cases.
- Minimum neighborhood quality: Reads for which the minimum quality of the bases is below the specified value will be ignored.
- Read direction filters: The read direction filter removes variants that are almost exclusively present in either forward or reverse reads.
- Direction frequency %: Variants that are not supported by at least this frequency of reads from each direction are removed.
- Relative read direction filter: The relative read direction filter attempts to do the same thing as the Read direction filter, but does this in a statistical, rather than absolute, sense: it tests whether the distribution among forward and reverse reads of the variant carrying reads is different from that of the total set of reads covering the site. The statistical, rather than absolute, approach makes the filter less stringent.
- Significance %: Variants whose read direction distribution is significantly different from the expected with a test at this level, are removed. The lower you set the significance cut-off, the fewer variants will be filtered out.
- Read position filter: It removes variants that are located differently in the reads carrying it than would be expected given the general location of the reads covering the variant site.
- Significance %: Variants whose read position distribution is significantly different from the expected with a test at this level, are removed. The lower you set the significance cut-off, the fewer variants will be filtered out.
- Remove pyro-error variants: This filter can be used to remove insertions and deletions in the reads that are likely to be due to pyro-like errors in homopolymer regions. There are two parameters that must be specified for this filter:
- In homopolymer regions with minimum length: Only insertion or deletion variants in homopolymer regions of at least this length will be removed.
- With frequency below: Only insertion or deletion variants whose frequency (ignoring all non-reference and non-homopolymer variant reads) is lower than this threshold will be removed.
- Specify the value for which you would like the Identify MLST tool to report low coverage (figure 24.41). Click Next.
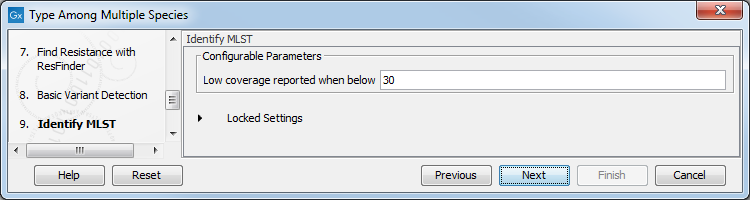
Figure 24.41: Specify when you would like low coverage to be reported for the Identify MLST tool. - In the Result handling window, pressing the button Preview All Parameters allows you to preview - but not change - all parameters. Choose to save the results (we recommend to create a new folder to this effect) and click on the button labeled Finish.
The following outputs are generated. You can find them all in the new folder you created to save them (figure 24.42), but those marked with a (*) have also been added automatically to the New Metadata Result Table (see the section Example of results obtained using the Type a Known Species (legacy) workflow to understand where your results have been saved).
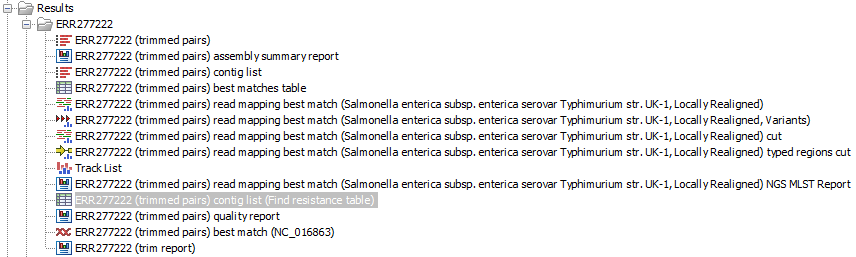
Figure 24.42: Output files from the Type among Multiple Species (legacy) workflow.
- Report: report from the Trim Sequences tool (see http://resources.qiagenbioinformatics.com/manuals/clcgenomicsworkbench/current/index.php?manual=Trim_output.html).
- Trimmed sequences: list of the sequences that were successfully trimmed.
- Assembly summary report: see http://resources.qiagenbioinformatics.com/manuals/clcgenomicsworkbench/current/index.php?manual=De_novo_assembly_report.html.
- Contig list: contig list from the De novo assembly tool
- (*)Contig list resistance table: result table from the Find Resistance with Nucleotide DB tool, reports the found resistance.
- Quality report: lists the best match as well as possible contaminants along with coverage level distributions for each reference genome listed.
- (*)Best match: sequence that matches best the data according to the Find Best Matches using K-mer Spectra tool.
- Matches table: contains the best matching sequence, a list of all (maximum 100) significantly matching references and a tabular report on the various statistical values applied.
- Read mapping best match: output from the Local Realignment tool, mapping of the reads using the Best Match as reference.
- Consensus NGS MLST Report: output from the Identify MLST tool, includes information on which MLST scheme was applied, the identified sequence type (ST) as well as an overview table which summarizes the targeted genes, their consensus sequence profile and coverage.
- Reads Tracks, Genome Track and/or Annotation Track: 2 outputs with the appendix "cut" or "typed regions cut" from the Extract Regions from Tracks tool.
- Track List: output from the Create Track List tool.
- Variant Track: output from the Basic Variant Detection tool. Note that it is possible to export multiple variant track files from monoploid data into a single VCF file with the Multi-VCF exporter. This exporter is uploaded to the workbench when installing the Microbial Genomics Module. All variant track files must have the same reference genome for the Multi-VCF export to work.
In addition, an extra column in the Result Metadata Table called "Best match, average coverage" helps the user to decide if a best match is significant, well covered and of good quality. This is especially helpful when a sample has low quality but is not contaminated.