Mask Low-Complexity Regions Report
An example of a Mask Low-Complexity Regions report can be seen in figure 22.5.
The summary statistics describes the following measures:
- Total nucleotides/amino acids: The total number of nucleotides (or amino acids for protein sequence input) that were processed.
- Masked nucleotides/amino acids: The total number of nucleotides (or amino acids for protein sequence input) that were masked or annotated.
- Ambiguous nucleotides/amino acids: The total number of ambiguous nucleotides (or amino acids for protein sequence input) that were masked or annotated.
- Total windows: The total number of windows that were processed (notice, that these may be overlapping)
- Masked windows: The total number of windows that were masked (notice, that these may be overlapping)
- Ignored windows: The total number of windows that were ignored (because they already contained ambiguous nucleotides, e.g. from an earlier run)
- Masked regions: The total number of regions that were masked (regions are formed by joining all overlapping or adjacent windows into contiguous sections)
The Mask Low-Complexity Regions complexity overview shows a bar chart with the number of windows for the different complexity levels.
A table provides examples from the input data for different complexity levels: this is shown in order to make it easier to understand what the Low-complexity threshold corresponds to.
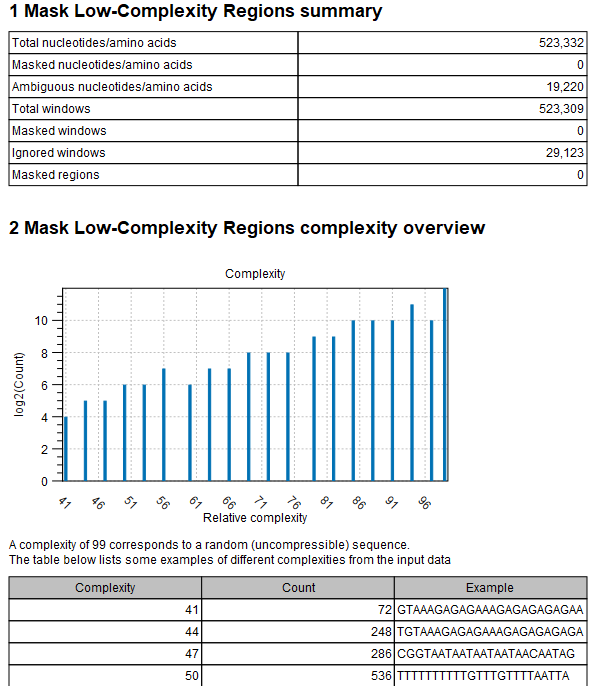
Figure 22.5: The Mask Low-Complexity Regions report.
#17821#>