Output from the Identify Somatic Variants from Tumor Normal Pair (WES) workflow
Eight different outputs are generated:
- Read Mapping Normal (
 ) The mapped sequencing reads for the normal sample. The reads are shown in different colors depending on their orientation, whether they are single reads or paired reads, and whether they map unambiguously. For the color codes please see the description of sequence colors in the CLC Genomics Workbench manual that can be found here: http://www.clcsupport.com/clcgenomicsworkbench/current/index.php?manual=View_settings_in_Side_Panel.html
- Read Mapping Tumor () The mapped sequencing reads for the tumor sample. The reads are shown in different colors depending on their orientation, whether they are single reads or paired reads, and whether they map unambiguously. For the color codes please see the description of sequence colors in the CLC Genomics Workbench manual that can be found here: http://www.clcsupport.com/clcgenomicsworkbench/current/index.php?manual=View_settings_in_Side_Panel.html.
- Target Region Coverage Report Normal (
 ) The report consists of a number of tables and graphs that in different ways provide information about the mapped reads from the normal sample.
- Target Region Coverage Tumor (
 ) A track showing the targeted regions. The table view provides information about the targeted regions such as target region length, coverage, regions without coverage, and GC content.
- Target Region Coverage Report Tumor () The report consists of a number of tables and graphs that in different ways provide information about the mapped reads from the tumor sample.
- Amino Acids Changes Track that shows the consequences of the variants at the amino acid level in the context of the original amino acid sequence. A variant introducing a stop mutation is illustrated with a red amino acid.
- Annotated Somatic Variants (
 ) A variant track holding the identified and annotated somatic variants. The variants can be shown in track format or in table format. When holding the mouse over the detected variants in the Genome Browser view a tooltip appears with information about the individual variants. You will have to zoom in on the variants to be able to see the detailed tooltip.
- Genome Browser View Tumor Normal Comparison (
 ) A collection of tracks presented together. Shows the annotated variants track together with the human reference sequence, genes, transcripts, coding regions, the mapped reads for both normal and tumor, the annotated somatic variants, information from the ClinVar database, and finally a track showing the conservation score (see figure 13.29).
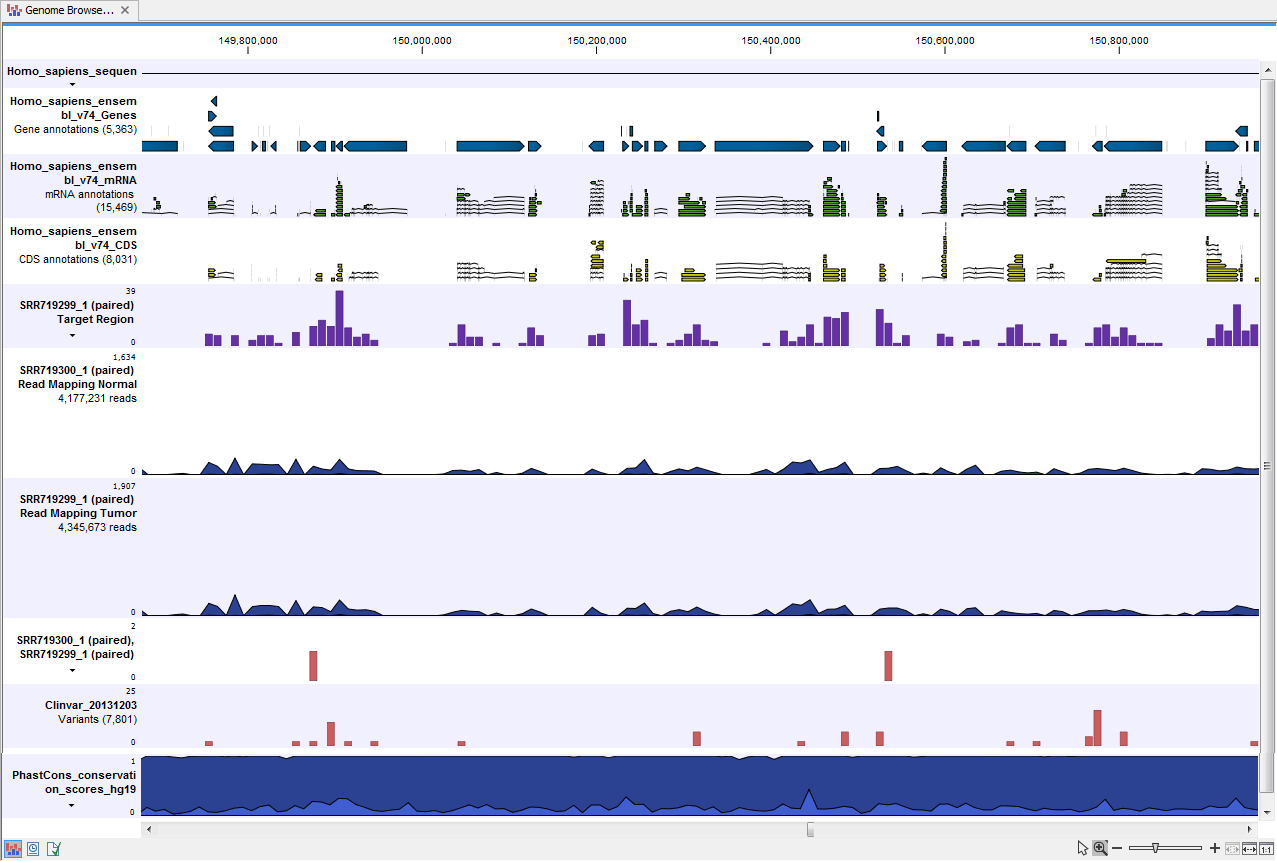
Figure 13.29: The Genome Browser View presents all the different data tracks together and makes it easy to compare different tracks.