The Violin Plot output of Create Expression Plot
Violin plots superimpose a kernel density plot on a box plot in order to provide more insight into the distribution of expressions in a sample. The box plot shows the median as a filled black square, the interquartile ranges as an unfilled black box, and the range of other non-outlier measurements as whiskers. Surrounding the box plot is the estimated kernel density that shows the shape of the data. In places with a wide distribution the probability to find data points is much larger compared to the narrower sections (figure 9.4).
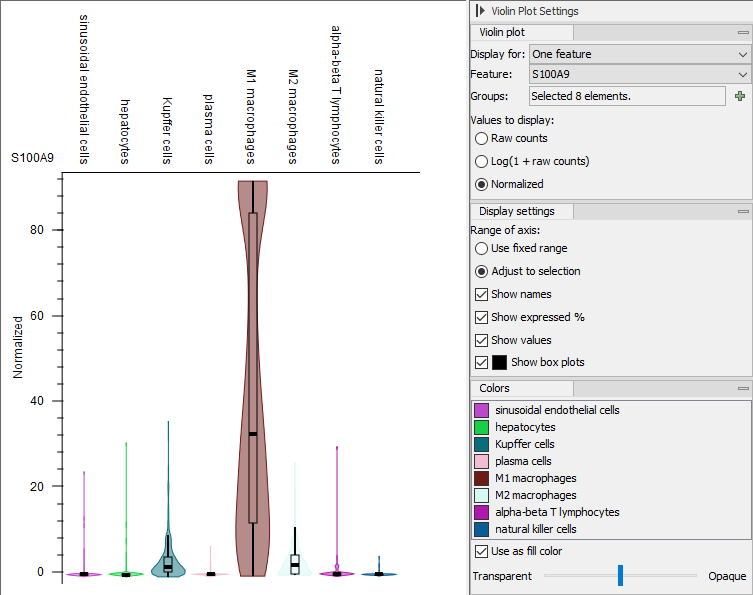
Figure 9.4: A Violin Plot visualization based on data from [MacParland et al., 2018] showing a specific feature across different groups of cells. Note the options in the side panel.
A number of options exist when looking at the Violin Plot Side Panel.
- Violin plot
- Choose features, groups or a mixture to be displayed. Select how the data should be represented: as raw counts, log(1+raw counts) or normalized.
- Display settings
- Add a legend and values to the plot. Show and hide the box plot.
- Colors
- Customize the colors of the individual plots.
A number of options for zooming and adjusting the size of the plot is provided. By clicking the small icons (![]() ) or (
) or (![]() ) it is possible to fix either the x-axis or y-axis when zooming.
) it is possible to fix either the x-axis or y-axis when zooming.
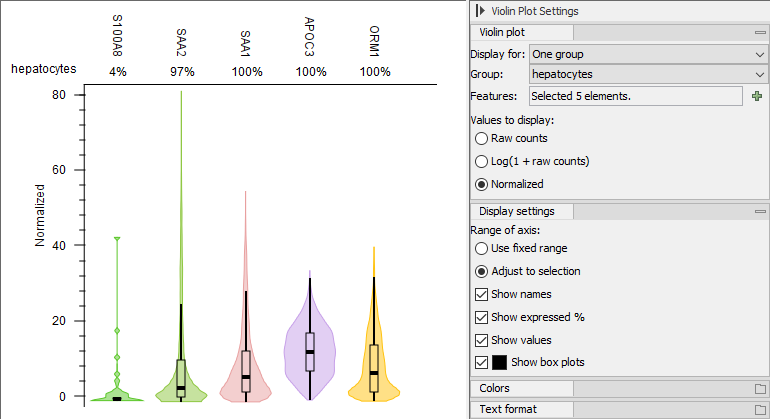
Figure 9.5: A Violin Plot visualization based on data from [MacParland et al., 2018]. Here, selected features are shown for hepatocyets. The percentage of cells expressing each feature is shown on top of the violins.
Several features can be displayed for one group of cells, as shown in figure 9.5. This can be useful for identifying marker genes when the cell types are not known or they need to be confirmed.
It is possible to pick and choose violins from different Violin Plots and to show them together in one plot. In order to do this, click on a feature or group label and right-click to bookmark the violin (see figure 9.6). All bookmarked violins will then appear in the same plotting area when selecting the bookmark option from the "Display for:" drop-down menu in the Side Panel. An example of a mixture plot is shown in figure 9.7.
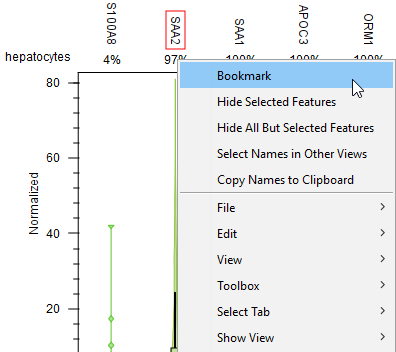
Figure 9.6: A Violin Plot visualization based on data from [MacParland et al., 2018] showing how to bookmark a violin.
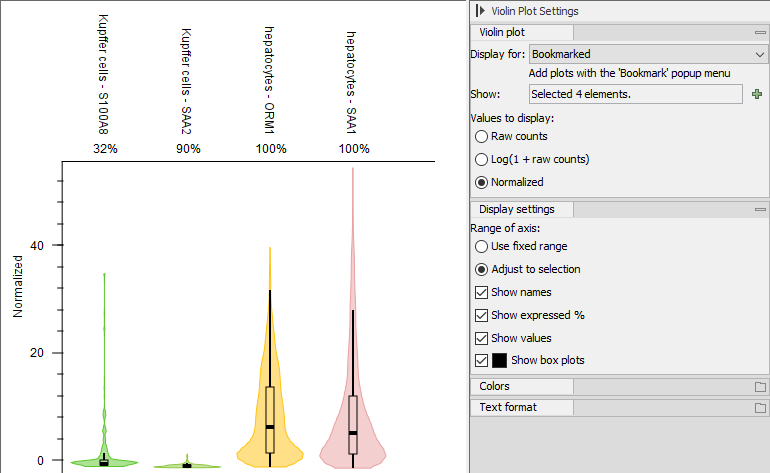
Figure 9.7: A Violin Plot visualization based on data from [MacParland et al., 2018] showing bookmarked violins with a mixture of both features and cell groups.