Choosing barcodes to retain
In the dialog for Count-based filters, a list of barcodes to be retained as cells can be specified. The desired barcodes can be obtained from the plots in the report.
As shown in figure 5.11, barcodes with a high number of reads / expressed features can be removed due to the fraction of reads that mapped to the mitochondria. These barcodes can be recovered by double-clicking on the desired plot, changing to the table view of the plot and applying a relevant filtering such that only the barcodes of interest are listed in the table (figure 5.15). The list of barcodes can be written in the Barcodes to retain field (see Count-based and extra-chromosomal filters). Note that the barcodes need to be separated by semicolon and after coping the barcodes from the table view, the text requires editing to add the semicolon separator.
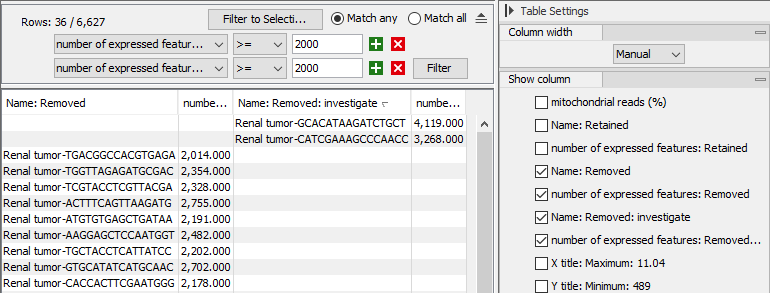
Figure 5.15: Table view of the "Number of expressed features vs mitochondria reads" plot from figure 5.11. The table is filtered to only show barcodes that have been removed and have at least 2,000 expressed features.
When the QC for Single Cell is run with retaining these barcodes, it will produce a report that highlights the retained barcodes as known cells, as shown in figure 5.16.
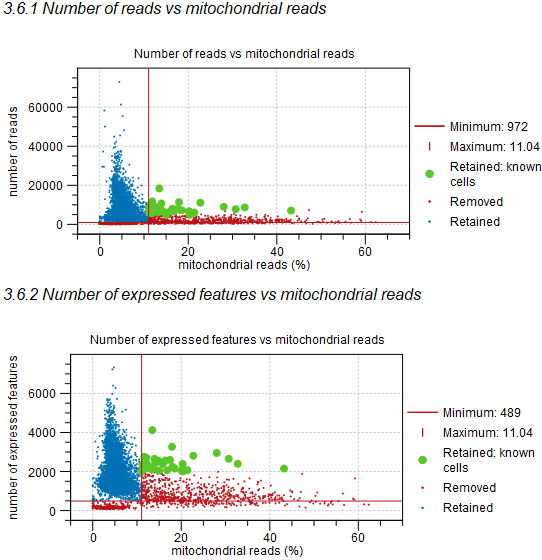
Figure 5.16: The number of reads mapped to the mitochondria vs the total number of reads (top) and expressed features (bottom). Barcodes in red have been removed and those in blue have been retained. The thresholds for removing barcodes are shown as horizontal and vertical red lines. Barcodes highlighted in green have been retained as user-specified known cells.
Note that this option also affects the Doublets filter. All barcodes to be retained as cells will be retained regardless of their doublet score. Such barcodes are highlighted in the doublet score relations plots.