Interpreting the output of Annotate Reads with Cell and UMI
The primary outputs of Annotate Reads with Cell and UMI are sequence lists (For each input, another sequence list of unmatched reads can be produced. This contains reads that do not match the provided read structure. In most cases this list will contain reads that are too short to contain the full cell barcode and UMI. If longer reads are present it may be worth checking that the read structure includes a variable length part.
The Annotate Reads with Cell and UMI report
The report includes summary statistics, a barcode ranks plot, and plots of the distributions of different nucleotides at each position in the cell barcode and UMI (if present).
The summary statistics section shows the number of input and output reads together with the number of distinct cell barcodes (figure 4.5). Typically the number of distinct barcodes is large as it includes all barcodes, including those that arise from sequencing error. The number of cells can be approximated by the location of a sharp fall in the corresponding barcode ranks plot, which ranks the barcodes in decreasing order of the number of reads (figure 4.6).
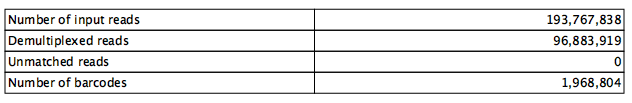
Figure 4.5: Summary statistics for data where R1 is discarded after the cell barcode and UMI have been extracted. In this example, 193 767 838 reads are present in the input. After discarding R1, 193 767 838 / 2 = 96 883 919 reads are present in the output. There are 1 968 804 distinct cell barcodes.
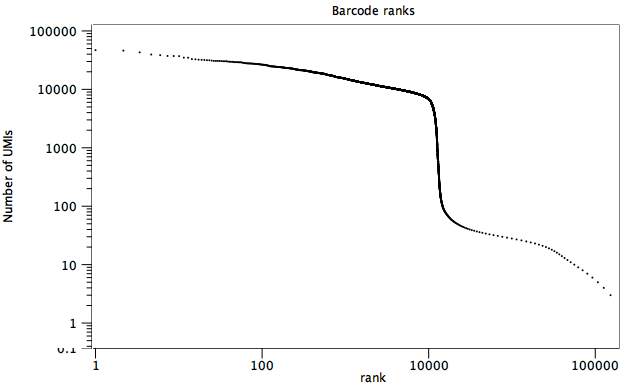
Figure 4.6: The barcode ranks plot for the data shown in figure 4.5. A sharp transition from an average of >10000 reads to <100 reads per barcode is seen at x = 10000, suggesting that there are approximately 10000 cells in the data.
The plots of the distributions of different nucleotides at each position of the cell barcode/UMI are made using all the demultiplexed reads. For simplicity the remainder of this section will talk about `barcodes', but the description is equally true for UMIs.
Typically, barcodes are randomly generated, or else designed to be very different from each other, such that all nucelotides are observed at each barcode position, and in approximately equal amounts. Errors may be detected when the barcode plots do not show this behavior, such as in figure 4.7, where position 1 in the barcode is mostly `A', position 2 is mostly `A', position 3 is mostly `G' etc. It appears that one barcode contains almost all the reads in the sample. In this case, the cell barcode part of the read structure has been misconfigured to read an adapter with sequence `AAGCAGTGGT'. The same plot with the correct read structure is shown in figure 4.8.
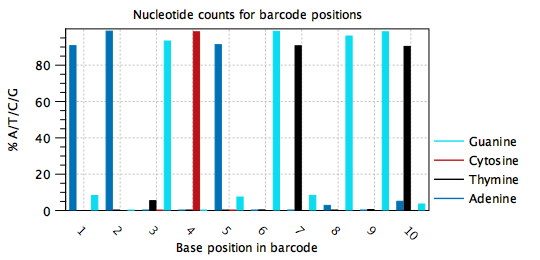
Figure 4.7: Nucleotide distribution plot for a misconfigured barcode. One barcode with sequence `AAGCAGTGGT' is present in most of the reads. In this case the barcode was misconfigured to be part of an adapter.
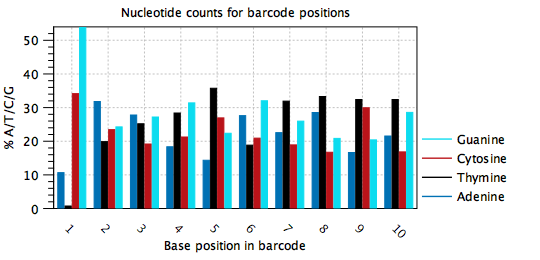
Figure 4.8: Nucleotide distribution plot for the same data as in figure 4.7. All nucleotides are seen at all positions of the barcode with comparable frequencies, except for at position 1. This dataset is from a 96-well protocol where the barcodes for each well are known in advance. In this case, it was possible to verify that the nucleotide distribution at position 1 should be skewed.