Launching of Create Expression Plot
By choosing 'Create Expression Plot' from the dimensionality reduction plot right-click menu (see figure 13.3), the tool Create Expression Plot can be started (see Create Expression Plot). The dialog is automatically filled in with the relevant information from the plot (see figure 13.22).
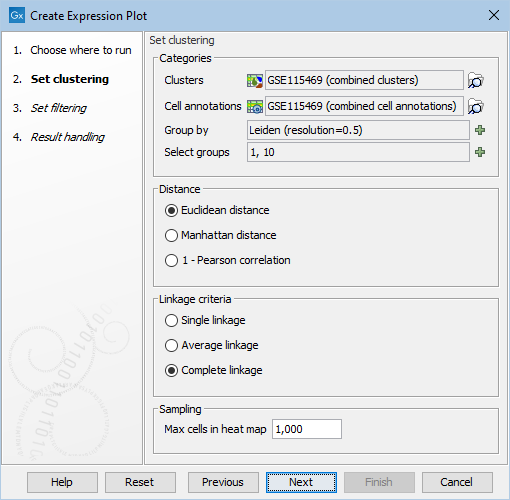
Figure 13.22: Dialog for Create Expression Plot (see Create Expression Plot) when started from the plot. The clusters and annotations that are associated with the plot are automatically filled in. The selected cluster is automatically added to 'Group by'.