Getting started
The genotype track (The genotype track contains two separate table views, the locus table (see Locus table) and the allele table (see Allele table), in order to represent variants at the locus, allele and haplotype level.
- Locus-level representation refers to all alleles at a genomic position represented in one line in the genotype track locus table corresponding to one line in a VCF file (figure 13.5).
- Allele-level representation refers to one allele at a given position which means one locus or genomic position can be represented with multiple rows. This is provided in the allele table and is similar to a Variant track (figure 13.5).
- Haplotype-level representation refers to a set of phased alleles and is visualized in the track viewer by connecting phased alleles with lines (figure 13.6). The haplotypes a variant is part of are also specified in the annotation Haplotypes in the allele table. In addition, phased genotypes that describe haplotypes are provided as the annotation Phase set in the locus table. Note that the phasing lines in the track viewer are not shown when more than 500 bases are inspected and no variants are present within the view.
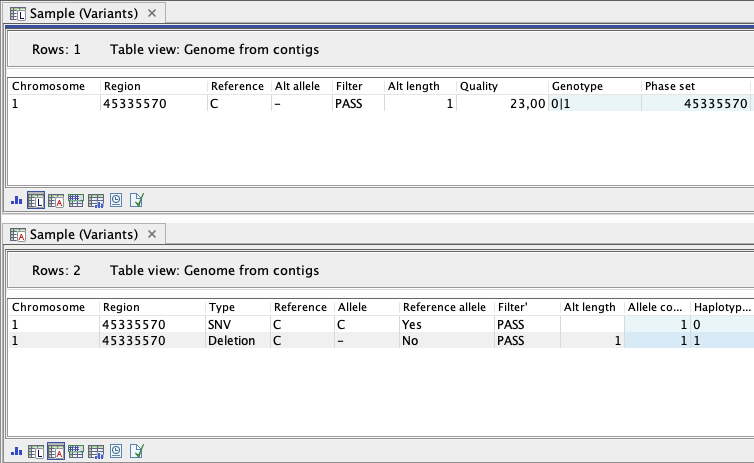
Figure 13.5: A heterozygous variant represented in the locus table with one line (upper panel) and in the allele table with two lines (lower panel), one for each allele at the genomic position. Only a subset of the available annotations are presented.
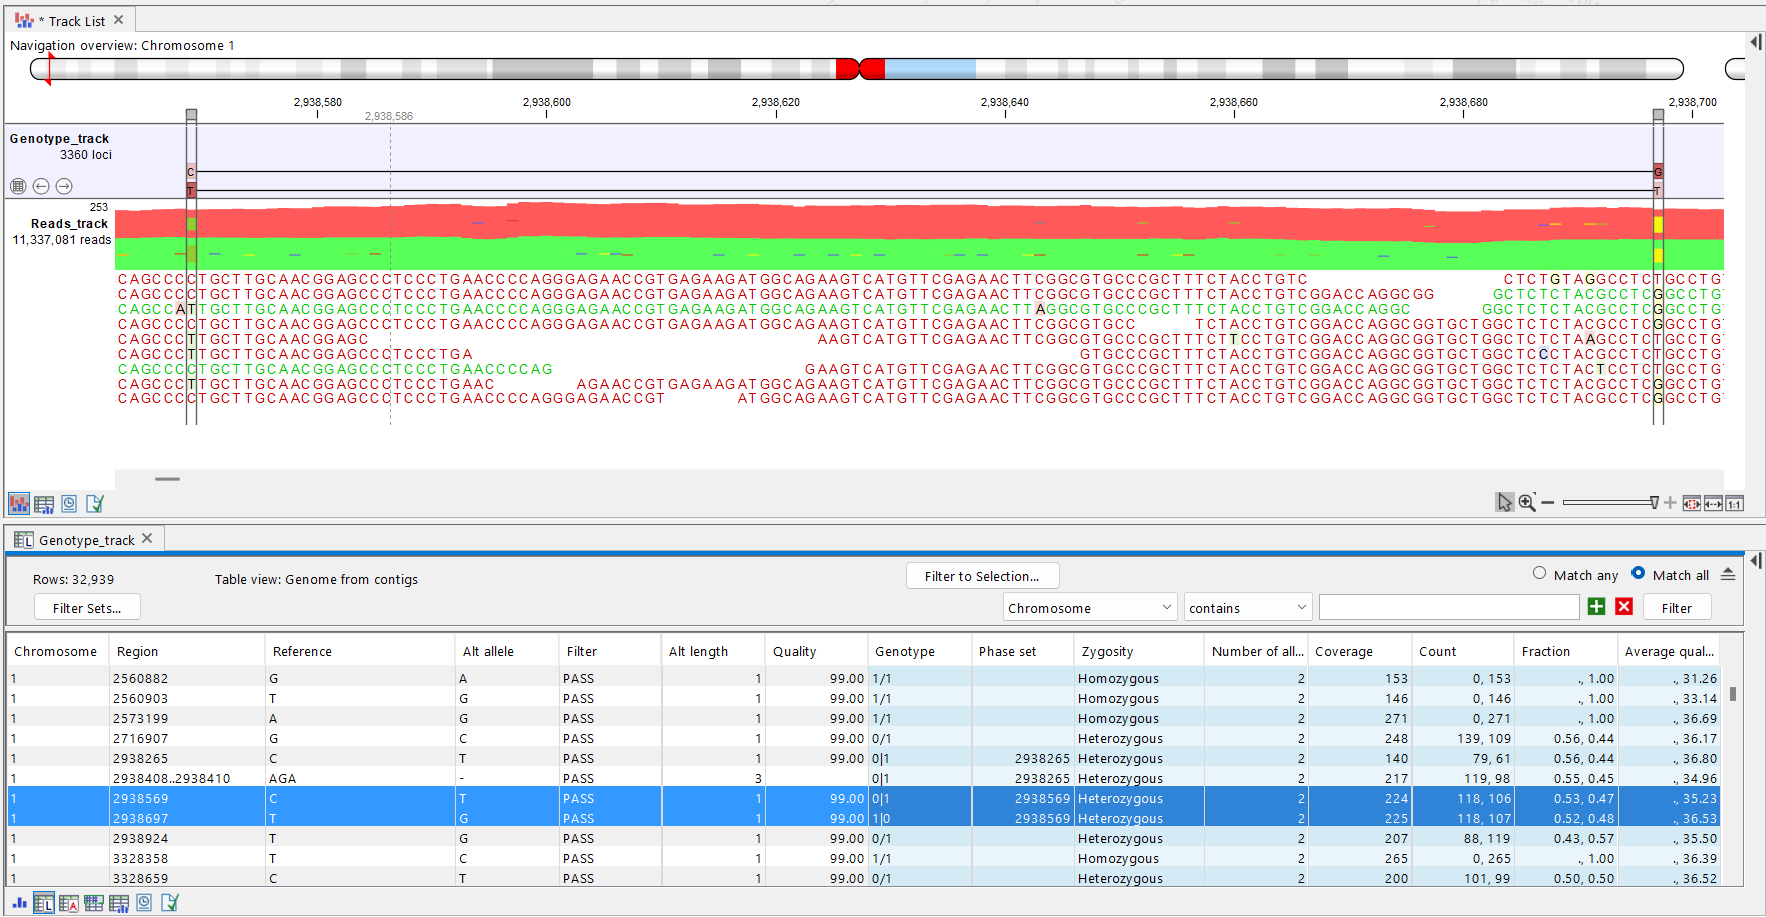
Figure 13.6: Vizualization of phasing information in the track viewer. The T variant in position 2938569 and the G variant in position 2938697 are on different haplotypes.