Copy Number Variant Detection (WGS)
The Copy Number Variant Detection (WGS) tool is designed to identify copy number variants (CNVs) from whole genome sequencing (WGS) data including low-pass WGS data.
The tool takes a read mapping as input and is designed to not rely on control samples. This is achieved by estimating the expected coverage for diploid regions via the following steps:
- The mean and standard deviation for the coverage is calculated for each chromosome. Only coverage values between the 10th and 90th percentile are included.
- Chromosomes are clustered based on their mean and standard deviation for the coverage.
- The cluster with the greatest density and highest number of chromosomes is selected using a weighted density value.
- Finally, the mean coverage for the selected cluster of chromosomes is calculated and used as the expected coverage for diploid regions.
If the tool is unable to find a robust cluster, the median coverage for all chromosomes will be used as the expected coverage for diploid regions.
The presence of XX or XY chromosomes is automatically determined by the tool based on the observed coverage. Note that only XX or XY can be assigned by the tool.
The tool defines non-overlapping windows that mapped reads are divided into, and calculates a coverage in each window that is adjusted for mapping quality and GC content. The resulting coverage in each window is normalized using the expected coverage for diploid regions. If any masking tracks are provided, the coverage will be ignored in the regions defined by these.
CNVs are detected using the normalized window coverage values with a hidden Markov model (HMM). The HMM consists of 11 different states for diploid chromosomes that each represent a copy number (0-10). Only 10 states (0-9) are used for haploid chromosomes, i.e. when there is both an X and a Y chromosome. For each window, we calculate a probability for each state based on the normalized coverage value and the sample purity. The HMM considers each window as an event, and then tries to find the most likely sequence of copy number states that explains these events. The boundaries of detected CNVs are refined by using a window of half the size of the original window.
A coefficient of variation is calculated based on the coverage windows across all chromosomes. This is used to set the copy number state transition probabilities in the HMM. This serves the purpose of making it less likely to detect a CNV when using noisy data. The coefficient of variation is also used for automatically determining the window size.
The HMM calculates a CNV score by initially obtaining the probability of the sequence of events that occurred (i.e. the states it traversed). Next, the probability that there is no CNV is found using the same calculations, but where only copy neutral states are traversed. The CNV score is finally calculated as the log-ratio between these two probabilities.
To run Copy Number Variant Detection (WGS):
Tools | LightSpeed (![]() ) | Copy Number Variant Detection (WGS) (
) | Copy Number Variant Detection (WGS) (![]() )
)
If you are connected to a CLC Server via your Workbench, you will be asked where you would like to run the analysis. We recommend that you run the analysis on a CLC Server when possible.
In the first wizard step, select a read mapping.
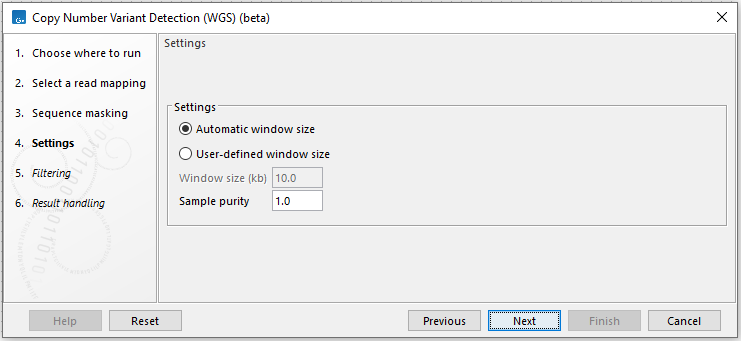
Next, options are available for window size selection and sequence masking (figure 16.1):
- Window size
- Automatic window size or Specify window size. Choose whether the tool should estimate the optimal window size based on the data or use a pre-specified window size.
- Window size (kb) Manually specify the window size. This affects the size of CNVs that can be detected. The lower the coverage, the larger the window size should be. CNVs typically need to span at least 2-3 consecutive windows to be called.
- Masking regions
- Centromeres Specify regions defining centromeres. Centromere regions are repetitive regions that can result in the detection of false positive CNVs.
- Pseudoautosomal regions (PAR) Specify PAR. PAR are homologous between the X and Y chromosome which similarly can result in the detection of false positive CNVs.
- Umap mappability Specify a graph track with position-wise mappability scores. Specific regions of the reference sequence are in a problematic way too likely/unlikely to have reads mapped resulting in false positive CNVs. This likelihood can be reflected by position-wise mappability scores. When a mappability track is provided the windows with an average mappability score below the provided minimum mappability score will not be used for estimating the coverage for diploid regions. In addition, identified CNVs with an average mappability score below the minimum mappability score value will be removed. We recommend using mappability scores from the tool Umap [Karimzadeh et al., 2018].
- Minimum mappability score Specify a minimum average mappability score for windows and identified CNVs.
Tracks containing centromere regions, PAR and Umap mappability scores are available for hg19 and hg38_no_alt_analysis_set in the Reference Data Manager. The tracks contain regions that are known to exhibit systematic abnormal coverage for different reasons, and we recommend masking with all three tracks when calling CNVs. Note that windows with more than 25% ambiguous nucleotides, i.e. N, will automatically be masked. In addition, detected CNVs are required to have less than 50% overlap with centromere and PAR regions and less than 40% overlap with N-masked regions.

Figure 16.1: Specify how the window size should be determined and provide tracks for sequence masking.
In the sample step, the following options are available (figure 16.2):

Figure 16.2: Provide sample information for CNV detection.
- Sample type
- Specify whether the sample should be considered germline or somatic. Germline samples are assumed to have ploidy 2 and purity 1.0. For somatic samples the purity and ploidy can be estimated or manually specified.
- Purity and ploidy
- Choose to manually specify the purity and ploidy or have the tool automatically estimate the values. Purity is taken into account when predicting the copy number states of individual windows. A lower purity will result in the detection of more CNVs. Note that the automatic estimation of purity and ploidy is performed by fitting the observed CNVs to a range of purity and ploidy values and selecting the best fit. It therefore only serves as an estimation. The automatic estimation will accept a maximum ploidy value of 6.
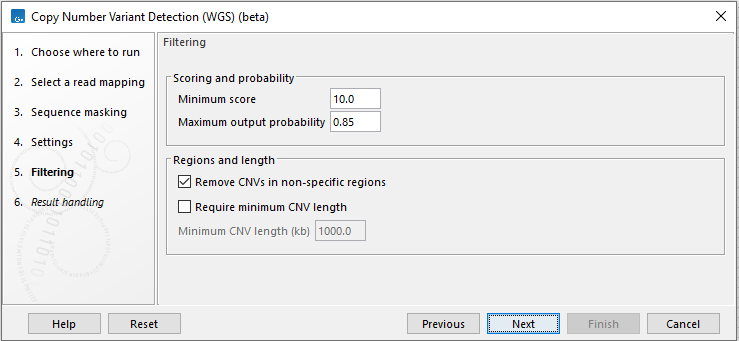
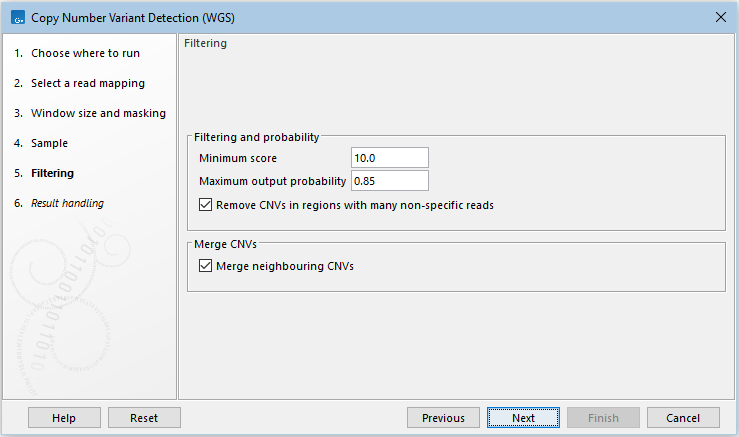
Next, options that can be used to filter CNVs are available (figure 16.3):

Figure 16.3: Specify filtering for CNV detection.
- Filtering and probability
- Minimum score Remove CNVs with a CNV score below this cutoff (see how the CNV scores are calculated by the HMM above).
- Maximum output probability The maximum copy number state output probabilities calculated by the HMM can be limited to this threshold. The threshold also sets a minimum output probability that is equal to 1.0 - maximum output probability. Decreasing the maximum output probability will typically result in fewer and shorter CNVs, and increasing the maximum output probability will typically result in more and longer CNVs.
- Remove CNVs in regions with many non-specific reads Enabling this option will remove CNVs where more than half of the underlying windows contain a high fraction of non-specifically mapped reads. The threshold for a high fraction of non-specifically mapped reads is 25% for CNVs with a score below 25 and 50% for CNVs with a score above 25.
- Merge CNVs
- Merge CNVs that are in close relation and have been identified to have the same copy number.
The Copy Number Variant Detection (WGS) tool has the following limitations:
- Only chromosomes larger than 10Mb are considered.
- Broken reads are ignored because they can accumulate in specific places, e.g. at the boundaries of deletions.
- If the majority of chromosomes are affected by chromosome-wide CNVs, the expected coverage for diploid regions might be suboptimally estimated as affected chromosomes may define the cluster used to estimate the expected coverage.
- The tool is not able to discern female X loss from male Y loss.
- The tool is only able to call up to a copy number of 10. A CNV with copy number 10 should therefore be interpreted as 10 or more.
Subsections
