Calculate TMB Score (LightSpeed)
The Calculate TMB Score (LightSpeed) tool takes a variant track and the set of regions to focus on, and calculates a TMB score, i.e. the number of variants per 1 million bases.
It is recommended that target regions with a coverage lower than 100X are discarded before running the tool. To do so, a workflow including the tools Create Mapping Graph and Identify Graph Threshold Area can be used to generate a target region file only containing target regions with at least 100X coverage (see figure 15.1).
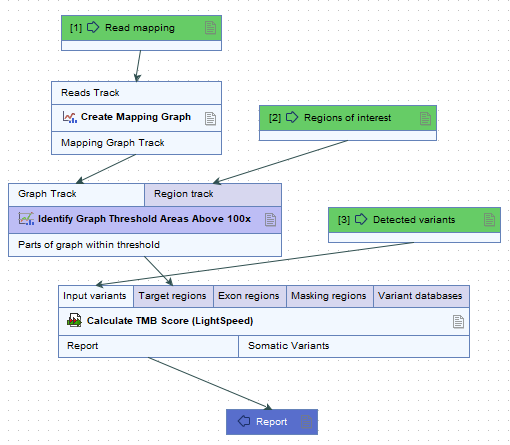
Figure 15.1: Workflow to discard low coverage target regions.
The Calculate TMB Score (LightSpeed) tool selects variants for analysis based on the following criteria:
- Variants must be SNVs.
- Variants must be within target regions.
- Variants must be within exonic regions.
- Variants must be outside masking regions.
To run Calculate TMB Score (LightSpeed), go to:
Tools | LightSpeed (![]() ) | Calculate TMB Score (LightSpeed) (
) | Calculate TMB Score (LightSpeed) (![]() )
)
The tool takes a variant track as input which is provided in the first dialog (figure 15.2):
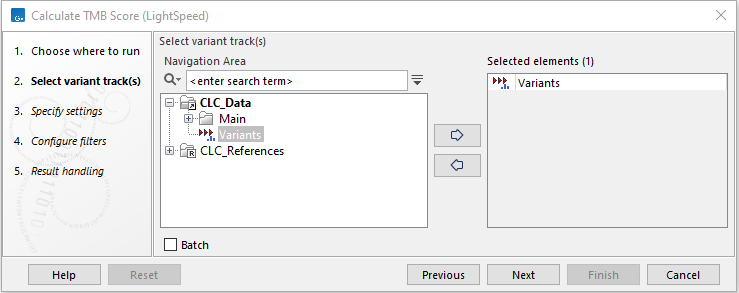
Figure 15.2: Select a variant track.
In the next dialog, tracks relevant to the analysis are specified (figure 15.3):
- Target regions A track containing the target regions.
- Exon regions An mRNA track containing exons.
- Masking regions Regions that should not be considered.
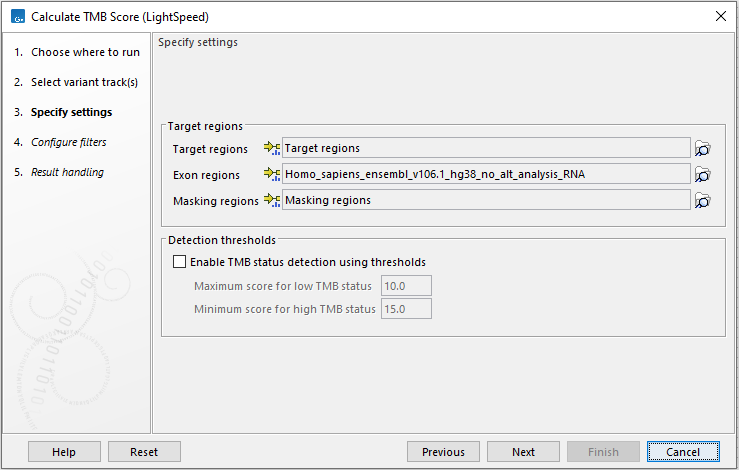
Figure 15.3: Specify tracks and parameters for calculating a TMB score.
It is also possible to calculate a TMB status based on thresholds for a low and a high TMB status. This will appear as an additional item in the TMB report. The default values of 10 and 15 have been chosen based on internal benchmark analyses. Samples with a score between the low and high threshold, will be assigned TMB status intermediate. Given the lack of standardization of TMB scoring methods and the heterogeneity of TMB across tumor types, we recommend manually specifying values that are suitable for the analyzed sample and tumor type.
In the next dialog (figure 15.4), variant filters can be configured:
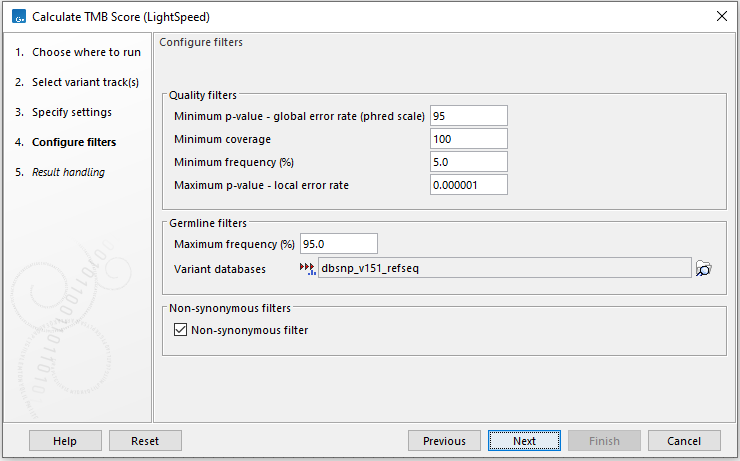
Figure 15.4: Configure variant filters.
- Quality filters
- Minimum p-value - global error rate (phred scale) Only variants that have achieved this level of significance when considering the global error rate are considered.
- Minimum coverage Only variants in regions covered by at least this many reads are considered.
- Minimum frequency (%) Only variants with a frequency above this value are considered.
- Maximum p-value - local error rate Only variants that have achieved this level of significance when considering the local error rate are considered.
- Minimum p-value - global error rate (phred scale) Only variants that have achieved this level of significance when considering the global error rate are considered.
- Germline filters
- Maximum frequency (%) Only variants with a frequency equal to or lower than the specified value will be considered. Variants with a frequency above this value are considered germline.
- Variant databases Specify a variant database such as dbSNP. Although dbSNP is thought to contain many erroneous calls, these may still be useful for removing variants that are not somatic, e.g. if they arise from common sequencing artifacts. It is mandatory to provide a variant database of known germline variants.
- Non-synonymous filters Only amino acid changing variants are kept and considered for the TMB score calculation.
The default quality filter thresholds have been determined based on internal benchmarking using samples from the Tumor Mutational Burden Harmonization Project led by Friends of Cancer Research [Vega et al., 2021].
The tool outputs a track of filtered somatic variants, i.e., the variants that remained after the filtering and that were included in the TMB score calculation. However, the main output is a report that includes filtering statistics and the calculated TMB score. It will also include a TMB status if the option was enabled (as shown in figure 15.5).
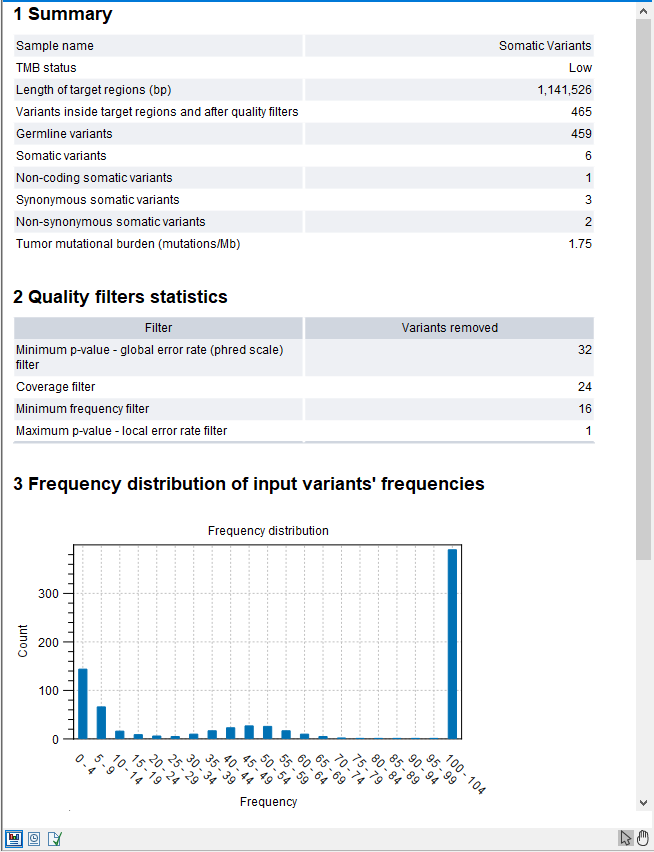
Figure 15.5: Part of a TMB report where the option to detect TMB status was enabled with default threshold values.
The report also lists the length of the assessed regions (the "Length of target regions (bp)" entry), counts of various types of variants, and a value describing the tumor mutational burden calculated as the number of mutations per Mb. The quality filters statistics recapitulates how many variants were removed by the various filters applied by the tool. The frequency distributions of input and somatic variants are also provided.
The TMB status is assessed with a confidence level based on the size of regions included in the TMB score calculation, i.e., the parts of the target regions that overlap with exons and that have a coverage of at least 100X. This is illustrated by the color of the TMB status table cell in the report. If the analyzed region size is below 900,000bp the cell will be colored in red, if it is between 900,000bp and 1,000,000bp it will be colored in yellow and if it is above 1,000,000bp it will not be colored. Note that if low coverage regions were not excluded from the target regions before TMB score calculation, the TMB status confidence level may wrongly be displayed as high.