Protein report
CLC Main Workbench is able to produce protein reports, a collection of some of the protein analyses described elsewhere in this manual.
To create a protein report do the following:
Toolbox | Protein Analysis (![]() )|
Create Protein Report (
)|
Create Protein Report (![]() )
)
This opens a dialog where you can choose which proteins to create a report for. If you had already selected a sequence in the Navigation Area before running the Toolbox action, this will be shown in the Selected Elements. However, you can use the arrows to change this. When the correct one is chosen, click Next.
In the next dialog, you can choose which analyses you want to include in the report. The following list shows which analyses are available and explains where to find more details.
- Sequence statistics. Will produce a section called Protein statistics, as described in Bioinformatics explained: Protein statistics.
- Protein charge plot. Plot of charge as function of pH, see Protein charge.
- Hydrophobicity plot. See Hydrophobicity.
- Complexity plot. See Local complexity plot.
- Dot plot. See Dot plots.
- Secondary structure prediction. See Secondary structure prediction.
- Pfam domain search. See Pfam domain search.
- BLAST against NCBI databases. See NCBI BLAST.
When you have selected the relevant analyses, click Next. In the following dialogs, adjust the parameters for the different analyses you selected. The parameters are explained in more details in the relevant chapters or sections (mentioned in the list above).
For sequence statistics:
- Individual Statistics Layout. Comparative is disabled because reports are generated for one protein at a time.
- Include Background Distribution of Amino Acids. Includes distributions from different organisms. Background distributions are calculated from UniProt www.uniprot.org version 6.0, dated September 13 2005.
For hydrophobicity plots:
- Hydrophobicity scales. Lets you choose between different scales.
- Window size. Width of window on sequence (it must be an odd number).
For complexity plots:
- Window size. Width of window on sequence (must be odd).
For dot plots:
- Score model. Different scoring matrices.
- Window size. Width of window on sequence.
For Pfam domain search:
- Database and search type lets you choose different databases and specify the search for full domains or fragments.
- Significance cutoff lets you set your E-value.
For BLAST against NCBI databases:
- Program lets you choose between different BLAST programs.
- Database lets you limit your search to a particular database.
- Genetic code lets you choose a genetic code for the sequence or the database.
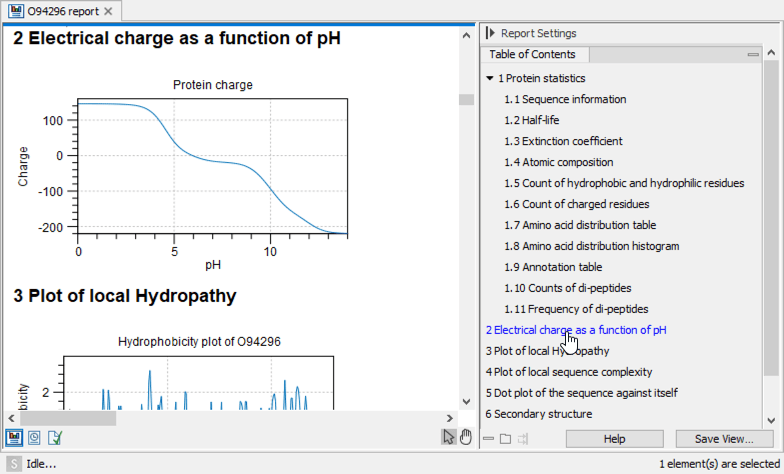
An example of Protein report can be seen in figure 20.23.

Figure 20.23: A protein report. There is a Table of Contents in the Side Panel that makes it easy to
browse the report.
By double clicking a graph in the output, this graph is shown in a different view (CLC Main Workbench generates another tab). The report output and the new graph views can be saved by dragging the tab into the Navigation Area.
The content of the tables in the report can be copy/pasted out of
the program and e.g. into Microsoft Excel. You can also Export (![]() ) the report in Excel format.
) the report in Excel format.
