Experiment level
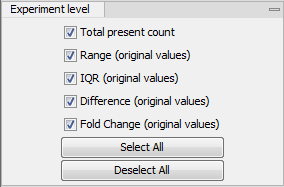
The rest of the Side Panel is devoted to different levels of information on the values in the experiment. The experiment part contains a number of columns that, for each feature ID, provide summaries of the values across all the samples in the experiment (see figure 25.6).

Figure 25.6: The initial view of the experiment level for a two-group experiment.
Initially, it has one header for the whole Experiment:
- Range (original values). The 'Range' column contains the difference between the highest and the lowest expression value for the feature over all the samples. If a feature has the value NaN in one or more of the samples the range value is NaN.
- IQR (original values). The 'IQR' column contains the inter-quantile range of the values for a feature across the samples, that is, the difference between the 75 %-ile value and the 25 %-ile value. For the IQR values, only the numeric values are considered when percentiles are calculated (that is, NaN and +Inf or -Inf values are ignored), and if there are fewer than four samples with numeric values for a feature, the IQR is set to be the difference between the highest and lowest of these.
- Difference (original values). For a two-group experiment the 'Difference' column contains the difference between the mean of the expression values across the samples assigned to group 2 and the mean of the expression values across the samples assigned to group 1. Thus, if the mean expression level in group 2 is higher than that of group 1 the 'Difference' is positive, and if it is lower the 'Difference' is negative. For experiments with more than two groups the 'Difference' contains the difference between the maximum and minimum of the mean expression values of the groups, multiplied by -1 if the group with the maximum mean expression value occurs before the group with the minimum mean expression value (with the ordering: group 1, group 2, ...).
- Fold Change (original values). For a two-group experiment the 'Fold Change' tells you how many times bigger the mean expression value in group 2 is relative to that of group 1. If the mean expression value in group 2 is bigger than that in group 1 this value is the mean expression value in group 2 divided by that in group 1. If the mean expression value in group 2 is smaller than that in group 1 the fold change is the mean expression value in group 1 divided by that in group 2 with a negative sign. Thus, if the mean expression levels in group 1 and group 2 are 10 and 50 respectively, the fold change is 5, and if the and if the mean expression levels in group 1 and group 2 are 50 and 10 respectively, the fold change is -5. Entries of plus or minus infinity in the 'Fold Change' columns of the Experiment area represent those where one of the expression values in the calculation is a 0. For experiments with more than two groups, the 'Fold Change' column contains the ratio of the maximum of the mean expression values of the groups to the minimum of the mean expression values of the groups, multiplied by -1 if the group with the maximum mean expression value occurs before the group with the minimum mean expression value (with the ordering: group 1, group 2, ...).
Thus, the sign of the values in the 'Difference' and 'Fold change' columns give the direction of the trend across the groups, going from group 1 to group 2, etc.
If the samples used are Affymetrix GeneChips samples and have 'Present calls' there will also be a 'Total present count' column containing the number of present calls for all samples.
The columns under the 'Experiment' header are useful for filtering purposes, e.g. you may wish to ignore features that differ too little in expression levels to be confirmed e.g. by qPCR by filtering on the values in the 'Difference', 'IQR' or 'Fold Change' columns or you may wish to ignore features that do not differ at all by filtering on the 'Range' column.
If you have performed normalization or transformation, the IQR of the normalized and transformed values will also appear. Also, if you later choose to transform or normalize your experiment, columns will be added for the transformed or normalized values.
Note! It is very common to filter features on fold change values in expression analysis and fold change values are also used in volcano plots. There are different definitions of 'Fold Change' in the literature. The definition that is used typically depends on the original scale of the data that is analyzed. For data whose original scale is not the log scale the standard definition is the ratio of the group means [Tusher et al., 2001]. This is the value you find in the 'Fold Change' column of the experiment. However, for data whose original is the log scale, the difference of the mean expression levels is sometimes referred to as the fold change [Guo et al., 2006], and if you want to filter on fold change for these data you should filter on the values in the 'Difference' column. Your data's original scale will e.g. be the log scale if you have imported Affymetrix expression values which have been created by running the RMA algorithm on the probe-intensities.
