Sequence statistics
CLC Genomics Workbench can produce an output with many relevant statistics for protein sequences. Some of the statistics are also relevant to produce for DNA sequences. Therefore, this section deals with both types of statistics. The required steps for producing the statistics are the same.
To create a statistic for the sequence, do the following:
Toolbox |
Classical Sequence Analysis (![]() ) | General Sequence Analysis (
) | General Sequence Analysis (![]() )|
Create Sequence Statistics (
)|
Create Sequence Statistics (![]() )
)
Select one or more sequence(s) or/and one or more sequence list(s). Note! You cannot create statistics for DNA and protein sequences at the same time, they must be run separately.
Next (figure 16.14), the dialog offers to adjust the following parameters:
- Individual statistics layout. If more sequences were selected in Step 1, this function generates separate statistics report for each sequence.
- Comparative statistics layout. If more sequences were selected in Step 1, this function generates statistics with comparisons between the sequences.
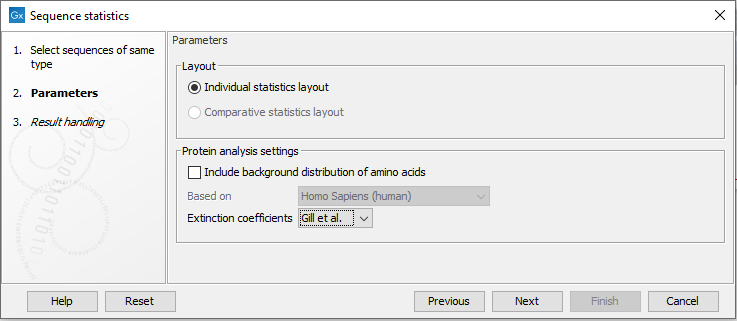
Figure 16.14: Setting parameters for the Sequence statistics tool.
For protein seqences, you can choose to include Background distribution of amino acids. If this box is ticked, an extra column with amino acid distribution of the chosen species, is included in the table output. (The distributions are calculated from UniProt www.uniprot.org version 6.0, dated September 13 2005.)
You can also choose between two different sets of values for calculation of extinction coefficients:
- [Gill and von Hippel, 1989]: Ext(Cystine) = 120, Ext(Tyr) = 1280 and Ext(Trp) = 5690
- [Pace et al., 1995]: Ext(Cystine) = 125, Ext(Tyr) = 1490 and Ext(Trp) = 5500
Click Finish to start the tool. An example of protein sequence statisticsis shown in figure 16.15.
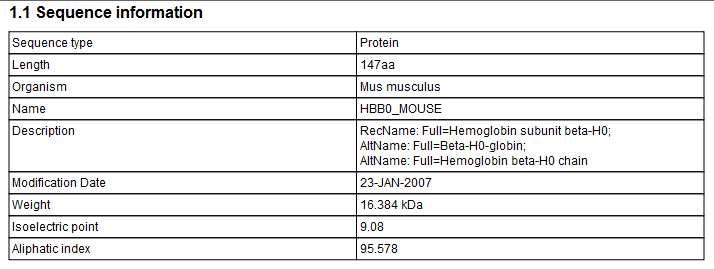
Figure 16.15: Example of protein sequence statistics.
Nucleotide sequence statistics are generated using the same dialog as used for protein sequence statistics. However, the output of Nucleotide sequence statistics is less extensive than that of the protein sequence statistics.
Note! The headings of the tables change depending on whether you calculate individual or comparative sequence statistics.
The output of protein sequence statistics includes:
- Sequence Information:
- Sequence type
- Length
- Organism
- Name
- Description
- Modification Date
- Weight. This is calculated like this:
 where
where linksis the sequence length minus one andunitsare amino acids. The atomic composition is defined the same way. - Isoelectric point
- Aliphatic index
- Amino acid counts, frequencies
- Annotation counts
The output of nucleotide sequence statistics include:
- General statistics:
- Sequence type
- Length
- Organism
- Name
- Description
- Modification Date
- Weight (calculated as single-stranded and double-stranded DNA)
- Annotation table
- Nucleotide distribution table
If nucleotide sequences are used as input, and these are annotated with CDS, a section on Codon statistics for Coding Regions is included.
A short description of the different areas of the statistical output is given in Bioinformatics explained: Protein statistics.
Subsections