Graphics export
CLC Genomics Workbench supports two ways of exporting graphics:
- You can export the current view, either the visible area or the entire view, by clicking on the Graphics button (
 ) in the top Toolbar. This is the generally recommended route for exporting graphics for individual data elements, and is described in Export graphics to files.
- For some data types, graphics export tools are available from the main Export menu, which can be opened by clicking on the Export (
 ) button in the top Toolbar. These are useful if you wish to export different data using the same view in an automated fashion, for example by running the export tool in batch mode or in a workflow context. This functionality is described below.
Using export tools to export graphics
The following types of data can be exported using dedicated export tools:
- Alignments
- Heat maps
- Read mappings
- Sequences
- Tracks
- Track lists
The general actions taken are:
- Click on the Export (
 ) button in the top Toolbar or choose the Export option under the File menu.
- Type "graphics" in the top field to see just a list of graphics exporters, and then select the one you wish to use. For example, if you wish to export an alignment as graphics, select "Alignment graphics" in the list.
- Select the data elements to be exported.
- Configure any relevant options. Detailed descriptions of these are provided below.
- Select where the data should be exported to.
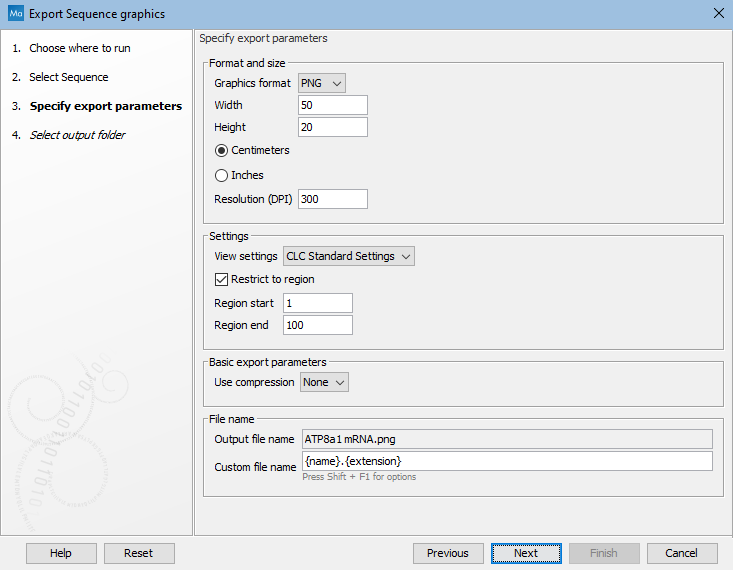
Options available when exporting sequences, alignments and read mappings to graphics format files are shown in figure 7.33.

Figure 7.33: Options available when exporting sequences, alignments and read mappings to graphics format files.
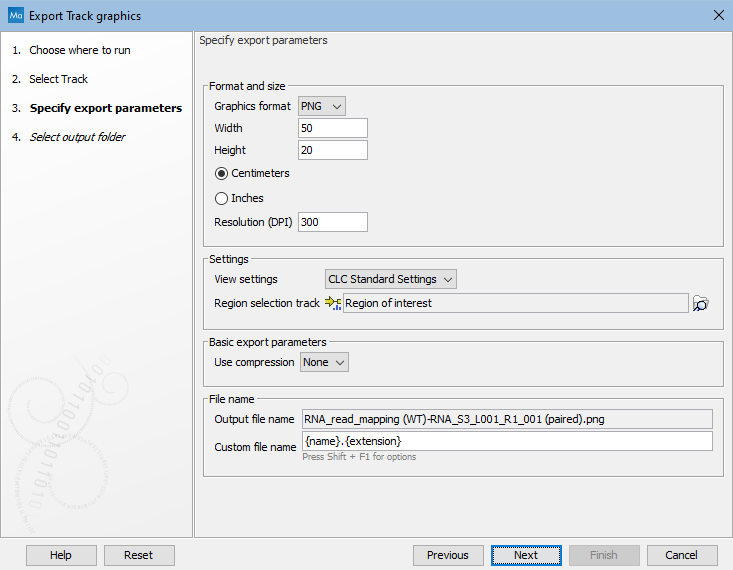
The options available when exporting tracks and track lists to graphics format files are shown in figure 7.34.

Figure 7.34: Options available when exporting tracks and track lists to graphics format files.
The format and size of the exported graphics can be configured using:
- Graphics format: Several export formats are available, including bitmap formats (such as .png, .jpg) and vector graphics (.svg, .ps, .eps).
- Width and height: The desired width and height of the exported image. This can be specified in centimeters or inches.
- Resolution: The resolution, specified in the units of "dpi" (dots per inch).
The appearance of the exported graphics can be configured using:
- View settings: The view settings available for the data type being exported. To determine how the data will look when a particular view is used, open a data element of the type you wish to export, click on the Save View button visible at the bottom of the Side Panel, and apply the view settings in the dialog that appears. View settings are described in View settings for the Side Panel. Custom view settings will be available to choose from when exporting if the "Save for all <data type> views" option was checked when the view was saved.
- Region restriction: The region to be exported. For sequences, alignments and read mappings, the region is specified using start and end coordinates. For tracks and track lists, you provide an annotation track, where the region corresponding to the full span of the first annotation is exported. The rest of the annotations in the track have no effect.
