Filtering on average expression
The FDR p-value is a multiple-testing correction for all tests that are performed. Sometimes power can be improved if genes are filtered prior to FDR correction. The filtering approach used is similar that of DESeq2 ([Love et al., 2014] , see section "Automatic Independent Filtering").
An example of the results of this procedure is shown in figure 31.28. The left side of the figure shows results with the option disabled, and the right side shows the same results with the option enabled. Loxhd1 is filtered away prior to the FDR correction, and so has "FDR p-value = NaN". All other genes have lower FDR p-values because fewer tests were performed as a result of the filtering. The total number of genes detected as significantly differentially expressed at a target FDR of 0.1 has been increased.
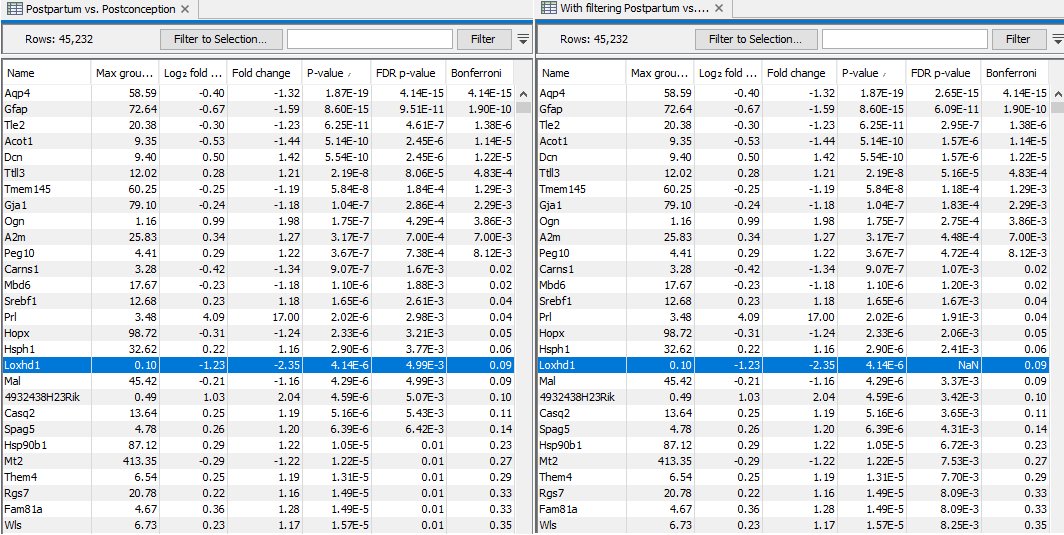
Figure 31.28: Results of the same test performed without (left) and with (right) filtering on average expression. Only the FDR p-values are changed. More genes are found significant at a target FDR of 0.1, but at a cost that genes with low average expression, such as Loxhd1, are filtered away.
Note that only the values in the FDR p-value column are changed. When filtering is enabled, low expression genes are filtered away prior to FDR correction. The exact threshold for low expression is determined by the tool and may be 0, in which case filtering has no effect. The threshold is chosen so as to maximize the number of significant tests at a target FDR of 0.1.
In detail, the determination of the filtering threshold works as follows:
- Genes are ordered by average counts, where the average includes all samples across all conditions.
- FDR corrections are run on the most expressed 1%, 2%... 100% of the genes, and the number of significant differentially expressed (DE) genes at a target FDR of 0.1 in each case is plotted.
- A smoothed line is fit to these data using local regression.
- An estimate is made of the variation in the number of DE genes around the line.
- The final filtering threshold is that which keeps most genes while being at most 1 standard deviation below the maximum number of DE genes.