RNA-Seq and Differential Gene Expression Analysis workflow
When running RNA-Seq expression analysis with differential gene expression it is essential to select tools that conduct appropriate analyses. Here we provide a basic workflow for analyses of RNA-Seq expression data. As input the workflow takes trimmed reads, to prepare these you can use the Prepare Raw Reads workflow or the Trim Reads tool on the imported samples. Save the samples into a folder that will be the input to the basic workflow.In addition to trimmed reads, the workflow requires metadata in the form of an Excel table describing the samples used in the analysis. When constructing the metadata file, make sure that the sample IDs can be linked to the names of trimmed reads (by exact match, prefix or suffix). Provide information that allow relevant grouping of samples such as Tumor/Normal, time series or tissue types. If biological or technical factors such as sex, date of sampling, or library prep batch are expected to influence the analysis, make sure to add these to the metadata as well, as the workflow will be able to handle confounding factors. See an example of a metadata file in figure 12.50.
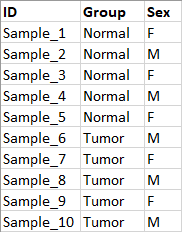
Figure 12.50: Metadata table describing 10 samples from a tumor normal experiment.
The workflow must be configured with reference data before it can run. All species can be used as long as reference data elements are available. The required elements without changing the workflow structure are:
- Sequence the reference sequence of the species.
- Genes track matching the sequence.
- mRNA track matching the sequence.
- CDS track matching the sequence.
- Gene Ontology GOA database for species.
The workflow is built using the Iterate and Collect and Distribute functionality, see Workflow control flow elements, meaning that there is no need to tick the batch functionality when selecting reads. The workflow simply analyses the expression profile for one sample at a time and then conducts the differential expression based on groupings provided in the metadata. This can be selected on workflow execution.
The tools and outputs provided by this workflow are:
- QC for Sequencing Reads outputs a report that is useful for validating the quality of the reads after trimming.
- RNA-Seq Analysis outputs the Gene Expression Track and a Mapping Report per sample.
- Differential Expression for RNA-Seq produces Statistical Comparison Tracks. As default, the tool is set up to expect Whole Transcriptome RNA-Seq data and to compare all groups specified in the metadata. This can easily be adjusted in the relevant wizard steps when running the workflow or the configurations can be changed in a copy of the workflow. The experimental design will depend on the metadata that is provided.
- Create Venn Diagram for RNA-Seq outputs a Venn diagram for up to 3 groups.
- Gene Set Test requires a GOA database and outputs a pathway analysis. When not available simply remove this element from the workflow.
- Create Expression Browser collects and combines the Gene Expression Track and Statistical Comparison Tracks into a single table.
- PCA for RNA-Seq produces a plot of all the gene expression samples.
- Create Heat Map for RNA-Seq produces a heat map of the top 25 features in the samples.
- Track List outputs a Genome Browser view of the sequence, genes, mRNA, CDS, and the differential gene expression results in the form of Statistical Comparison Tracks.
The RNA-Seq expression analysis is conducted at gene level and the differential expressions is hence reported at gene level. The workflow can easily be modified to conduct transcript level expression analysis. To modify the workflow you need to Open Copy of Workflow (right-click the workflow and select this option).
You find the workflow here:
Toolbox | Template Workflow | Basic Workflow Designs (![]() )
| RNA-Seq and Differential Gene Expression Analysis (
)
| RNA-Seq and Differential Gene Expression Analysis (![]() )
)
To run the workflow use the start button and follow the steps that is provided in the wizards.
- Select the trimmed reads and click Next.
- Select your reference data set or select "Use the default reference data" to configure the reference data elements in the coming wizard steps. Read more on creating reference data here: Custom Sets.
- Select your metadata excel file by choosing the "Select metadata from file" option. Specify the single sample batch identifier in the drop-down, see figure 12.51.
- Inspect the batch overview.
- In the next 5 wizards you can specify reference data elements when this was not specified in the select reference data step.
- Specify the differential expression parameters in this wizard step, see figure 12.52.
- Finally select a save location and press Finish.
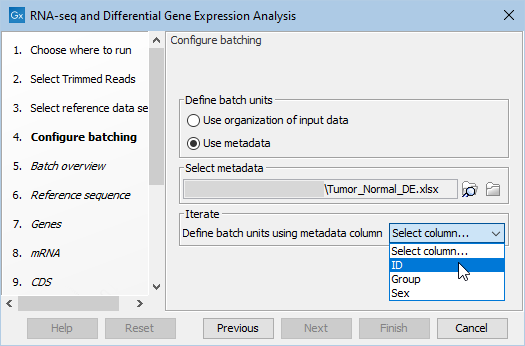
Figure 12.51: Atfer selection of the metadata file, select the samples identifyer in the drop-down menu.
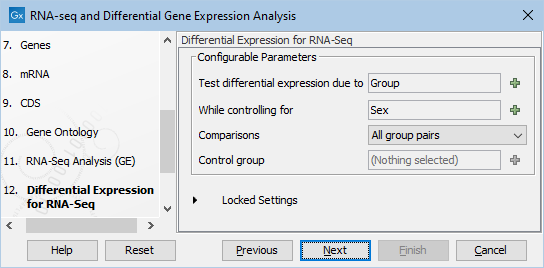
Figure 12.52: Specify based on the metadata how the differentital expression analysis should be conducted. In this case we chose to test differential expression due to Group (Tumor/Normal) while controling for Sex (F/M).
Workflow outputs resulting from analyses of all samples shown in figure 12.50 such as the PCA plot and the Venn Diagram are saved directly at the top level of the results folder. Outputs that are sample specific are organized in relevant sub folders, except expression tracks, see figure 12.53. Expression tracks for all samples are stored in the folder Gene Expression Tracks.
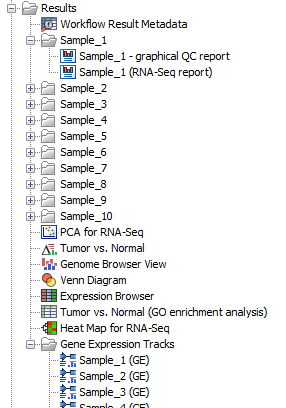
Figure 12.53: Overview of the outputs produced and how the folders are structured.