Sample level
In this part of the side panel, you can control which columns to be displayed for each sample. Initially this is the all the columns in the samples.If you have performed normalization or transformation, the normalized and transformed values will also appear.
An example is shown in figure 31.10.
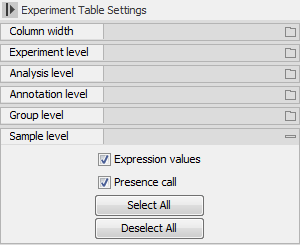
Figure 31.10: Sample level when transformation and normalization has been performed.