Read mapping settings
When you open a read mapping, there are many viewing options available in the Side Panel for customizing the layout.
- Read layout. This section appears at the top of the Side Panel when viewing a stand-alone read mapping:
- Compactness. The compactness setting options let you control the level of detail to be displayed. This setting affects many of the other settings in the Side Panel as well as the general behavior of the view. For example: if the compactness is set to Compact, you will not be able to see quality scores or annotations on the reads, even if these are turned on via the "Nucleotide info" palette of the Side Panel. You can change the Compactness setting in the Side Panel directly, or you can use the shortcut: press and hold the Alt key while you scroll with the mouse wheel or touchpad.
- Not compact. This allows the mapping to be viewed in full detail, including quality scores and trace data for the reads, where this is relevant. To view such information, additional viewing options under the Nucleotide info view settings must also selected. For further details on these, please see Trace settings in the Side Panel and Nucleotide info.
- Low. Hides trace data, quality scores and puts the reads' annotations on the sequence. You can see on figure 27.25 the Edit function that are available when right-clicking on a nucleotide.
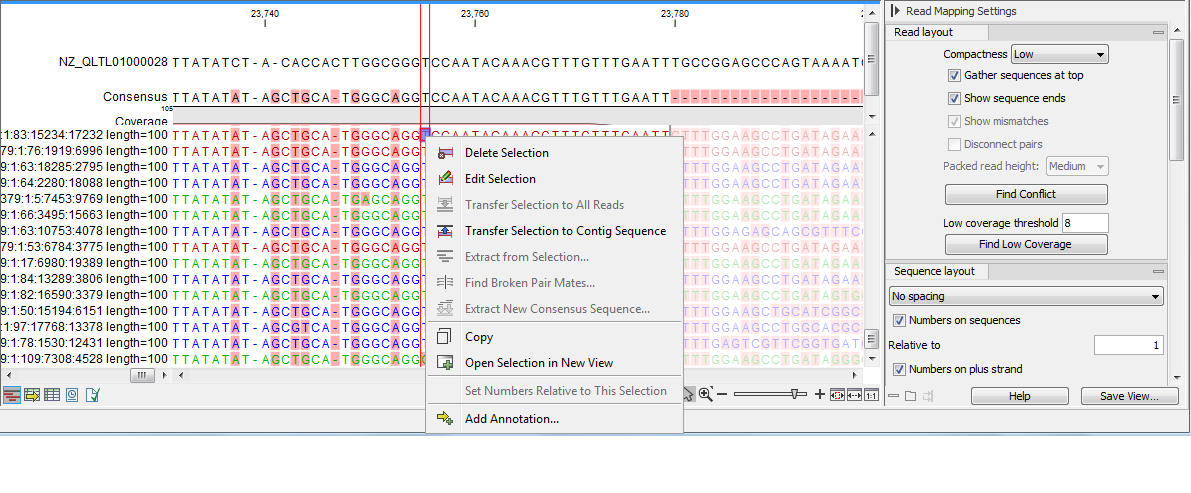
Figure 27.25: An example of the low compactness setting. - Medium. The labels of the reads and their annotations are hidden, and the residues of the reads cannot be seen.
- Compact. Even less space between the reads.
- Packed. All the other compactness settings will stack the reads on top of each other, but the packed setting will use all space available for displaying the reads. When zoomed in to 100%, you can see the residues but when zoomed out the reads will be represented as lines just as with the Compact setting. The packed mode is very useful when viewing large amounts of data. However certain functionality possible with other views are not available in packed view. For example, no editing of the read mapping or selections of it can be done and color coding changes are not possible. An example of the packed setting is shown in figure 27.26.
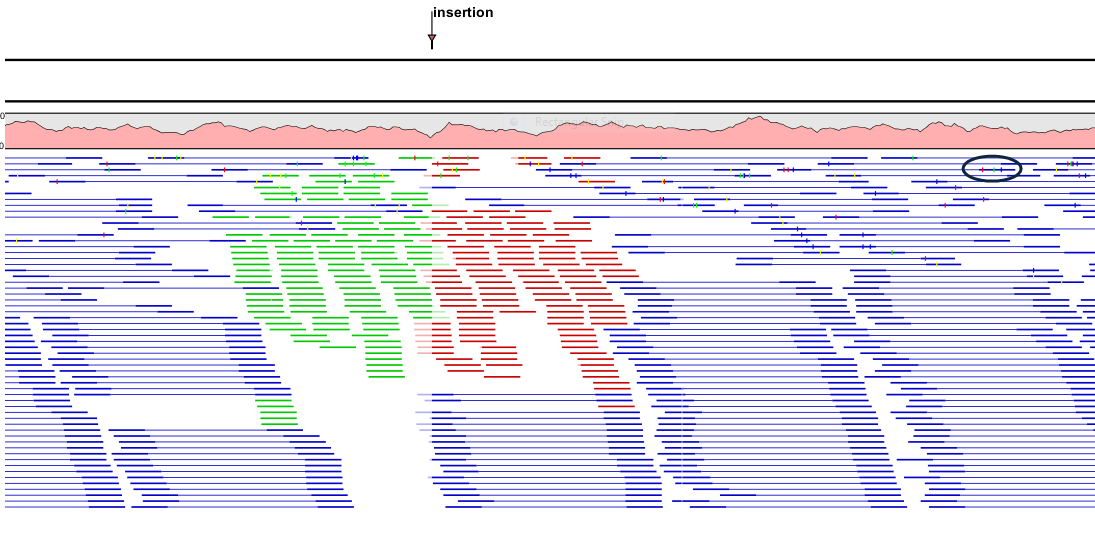
Figure 27.26: An example of the packed compactness setting. We highlighted in black an example of 3 narrow vertical lines representing mismatching residues.
- Gather sequences at top. If selected, the contributing sequence reads will automatically be placed right below the reference. This setting is not relevant when the compactness is packed.
- Show sequence ends. Regions that have been trimmed are shown with faded traces and residues. This illustrates that these regions have been ignored during the assembly.
- Show mismatches. When the compactness is packed, you can highlight mismatches which will get a color according to the Rasmol color scheme. A mismatch is whenever the base is different from the reference sequence at this position. This setting also causes the reads that have mismatches to be floated at the top of the view.
- Disconnect paired reads. This option will break up the paired reads in the display (they are still marked as pairs - this just affects the visualization). The reads are marked with colors for the direction (default red and green) instead of the color for pairs (default blue). This is particularly useful when investigating overlapping pairs in packed view and when the strand / read orientation is important.
- Packed read height. When the compactness is set to "packed", you can choose the height of the visible reads. When there are more reads than the height specified, an overflow graph will be displayed below the reads. The overflow graph is shown in the same colors as the sequences, and mismatches in reads are shown as narrow vertical lines (see figure 27.26). The colors of the small lines represent the mismatching residue. The color codes for the horizontal lines correspond to the color used for highlighting mismatches in the sequences (red = A, blue = C, yellow = G, and green = T), meaning that a red line with half the height of the blue part of the overflow graph will represent a mismatching "A" in half of the paired reads at this particular position.
- Find Conflict. Clicking this button selects the next position where there is an conflict between the sequence reads. Residues that are different from the reference are colored (as default), providing an overview of the conflicts. Since the next conflict is automatically selected it is easy to make changes. You can also use the Space key to find the next conflict.
- Low coverage threshold. All regions with coverage up to and including this value are considered low coverage. When clicking the 'Find low coverage' button the next region in the read mapping with low coverage will be selected.
- Compactness. The compactness setting options let you control the level of detail to be displayed. This setting affects many of the other settings in the Side Panel as well as the general behavior of the view. For example: if the compactness is set to Compact, you will not be able to see quality scores or annotations on the reads, even if these are turned on via the "Nucleotide info" palette of the Side Panel. You can change the Compactness setting in the Side Panel directly, or you can use the shortcut: press and hold the Alt key while you scroll with the mouse wheel or touchpad.
- Sequence layout. There is one additional parameter to those described in Sequence Layout
- Matching residues as dots. Matching residues will be presented as dots. Only the top sequence will be preserved in its original format.
- Residue coloring. There is one additional parameter to those described in Residue coloring
- Sequence colors. This option lets you use different colors for the reads.
- Main. The color of the consensus and reference sequence. Black per default.
- Forward. The color of forward reads (single reads). Green per default.
- Reverse. The color of reverse reads (single reads). Red per default.
- Paired. The color of paired reads. Blue per default. Note that reads from broken pairs are colored according to their Forward/Reverse orientation or as a Non-specific match, but with a darker nuance than ordinary single reads.
- Non-specific matches. When a read would have matched equally well another place in the mapping, it is considered a non-specific match. This color will "overrule" the other colors. Note that if you are mapping with several reference sequences, a read is considered a double match when it matches more than once across all the contigs/references. A non-specific match is yellow per default.
- Sequence colors. This option lets you use different colors for the reads.
- Alignment info. There are additional parameters to the ones described in View alignments.
- Coverage: Shows how many sequence reads that are contributing information to a given position in the read mapping. The level of coverage is relative to the overall number of sequence reads.
- Paired distance: Plots the distance between the pairs of paired reads.
- Single paired reads: Plots the percentage of reads marked as single paired reads (when only one of the reads in a pair matches).
- Non-specific matches: Plots the percentage of reads that also match other places.
- Non-perfect matches: Plots the percentage of reads that do not match perfectly.
- Spliced matches: Plots the percentage of reads that are spliced.
- Foreground color. Colors the letters using a gradient, where the left side color is used for low coverage and the right side is used for maximum coverage.
- Background color. Colors the background of the letters using a gradient, where the left side color is used for low coverage and the right side is used for maximum coverage.
- Graph. The coverage is displayed as a graph (Learn how to export the data behind the graph).
- Height. Specifies the height of the graph.
- Type. The graph can be displayed as Line plot, Bar plot or as a Color bar.
- Color box. For Line and Bar plots, the color of the plot can be set by clicking the color box. If a Color bar is chosen, the color box is replaced by a gradient color box as described under Foreground color.