Prediction of target-level CNVs
This section of the algorithm report gives information about the statistical models used to predict target-level CNVs.Adjustment of log2-ratios The first two graphs in this section are related to the adjustment of the log-ratios of coverages as a function of log-coverage. The log-ratio of coverages for targets depends on the level of coverage of the target, as observed by Li et al. (Bioinformatics, 2012), who also proposed that a linear correction should be applied[Li et al., 2012]. In the first of the two graphs, the non-adjusted log-ratios of target coverages are plotted against the log-coverage of the targets. In the second graph, the mean log-ratios are plotted after adjustment (figure 28.31). If the model fits the data, we expect to see that the adjusted mean log-ratios are centered around 0 for all log-coverages, and the variation decreases with increasing log-coverage.
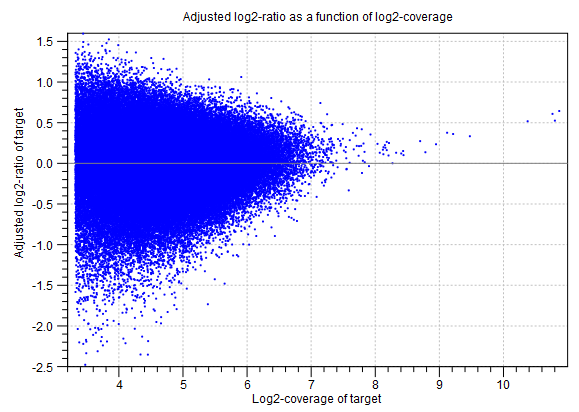
Figure 28.31: An example graph showing the mean adjusted log-ratios of coverages plotted against the log-coverages of targets, in the algorithm report of the Copy Number Variation Detection tool. Here, the adjusted mean log-ratios are centered around 0.0 for most coverages, and the variation decreases with increasing log-coverage. This indicates a good fit of the model. However, at very high coverages, the adjusted log-ratios are centered higher than 0.0, which indicates that for these coverages, the model is not a perfect fit. But only very few targets are affected by this, as the points are very sparse at these high coverage levels.
Statistical model for adjusted log2-ratios In this section of the algorithm report, you can see how well the algorithm was able to model the statistical variation in the log-ratios of coverages. An example is shown in figure 28.32). A good fit of the model to the data points indicates that the variance has been modeled accurately.
To make the points more visible, double-click the figure, to open it in a separate editor. Here, you can select how to visualize the data points and the fitted model. For example, you can choose to highlight the data points in the sidepanel:
MA Plot Settings | Dot properties | Dot type | "Dot"
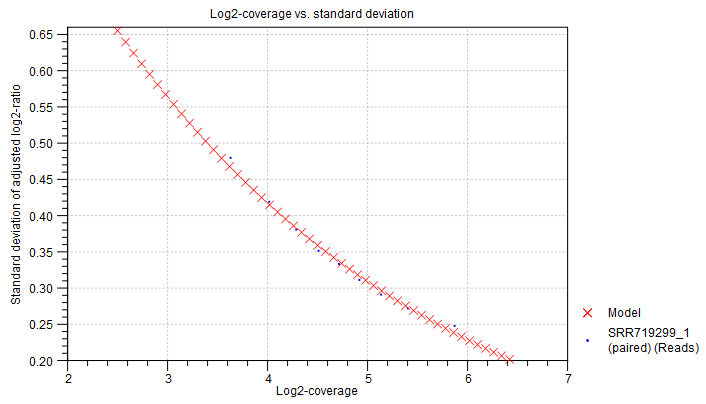
Figure 28.32: An example graph showing how the variance in the target-level mean log-ratios was modeled in the algorithm report of the Copy Number Variation Detection tool. Here, the data points are very close to the fitted model, indicating a good fit of the model to the data.
Distribution of adjusted log2-ratios in bins One of the assumptions of the statistical model used by the CNV detection tool is that the coverage log-ratios of targets are normally distributed with a mean of zero, and the variance only depends on the log-coverage of each target in the baseline. The bar charts in this section of the algorithm report show how well this assumption of the model fits the data. An example is shown in figure 28.33). A good fit of the model to the data points indicates that the variance has been modeled accurately.
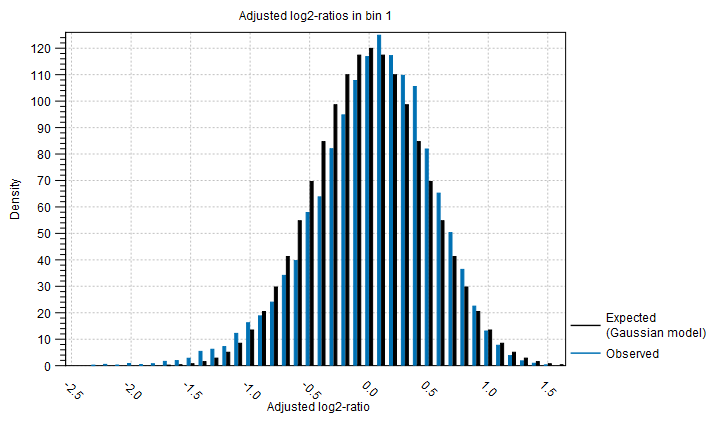
Figure 28.33: An example bar chart from the algorithm report of the Copy Number Variation Detection tool, showing how well the normal distribution assumption was fulfilled by the adjusted coverage log-ratios. Here, there is a good correspondence between the expected distribution and the observations.