QIAseq miRNA Differential Expression
The workflow calculates differential expressions for expression tables with associated metadata using multi-factorial statistics based on a negative binomial Generalized Linear Model (GLM). Both Grouped on Mature and Grouped on Seed expression tables can be used.
The expression tables are sent to:
- Create Heat Map for miRNA The tool creates a two dimensional heat map of expression values. Each column corresponds to one sample, and each row corresponds to a feature (a miRNA or seed sequence). The samples and features are both hierarchically clustered.
- Differential Expression for miRNA The tool performs a statistical differential expression test and outputs Statistical Comparison Tables that are used as input for the following tools:
- Gene Set Test Note that this will not yield any results when the workflow is run with Seeds, as no Gene Ontology annotations are known for seeds.
- Create Expression Browser This creates a table where each row includes the expression values of all samples and the contents of all the statistical comparison tables.
- Create Venn Diagram for RNA-Seq The Venn diagram comparison visualizes the overlap between the differentially expressed miRNAs in the selected statistical comparison tables. The miRNA considered to be differentially expressed can be controlled by setting appropriate p-value and fold change thresholds.
- Gene Set Test Note that this will not yield any results when the workflow is run with Seeds, as no Gene Ontology annotations are known for seeds.
To run the workflow, go to:
Template Workflows | Biomedical Workflows (![]() ) | Small RNA Sequencing (
) | Small RNA Sequencing (![]() ) | QIAseq miRNA Differential Expression (
) | QIAseq miRNA Differential Expression (![]() )
)
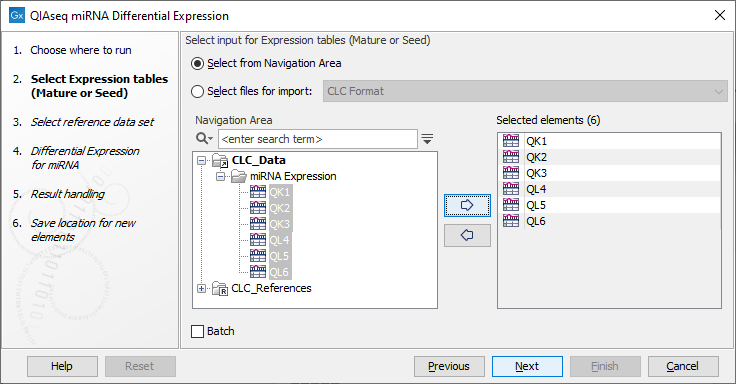
Choose the expression data to be analyzed (figure 15.19). The workflow takes Grouped on mature, Grouped on custom database and Grouped on seed expression tables, but note that only samples generated using the same parameters should be analyzed together.

Figure 15.19: Select the expression data to be compared.
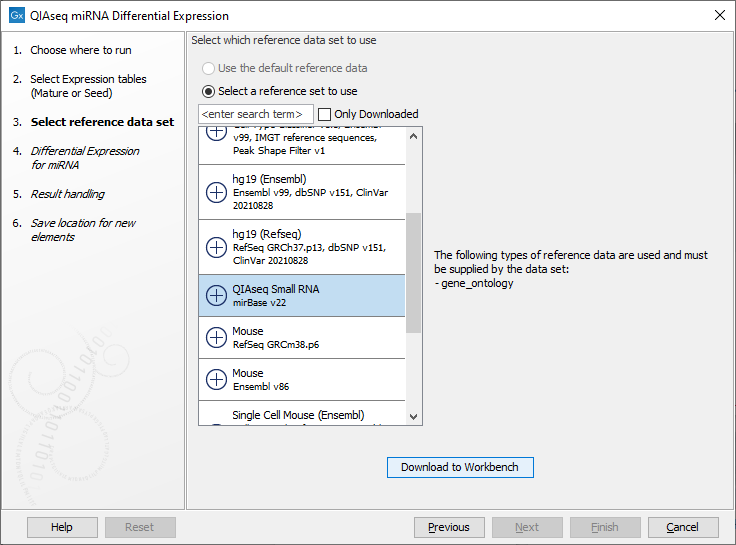
Then select the QIAseq Small RNA Reference Data Set as in figure 15.20. You can download the Data Set if you have not done so before.

Figure 15.20: Select and download if necessary the relevant Reference Data Set.
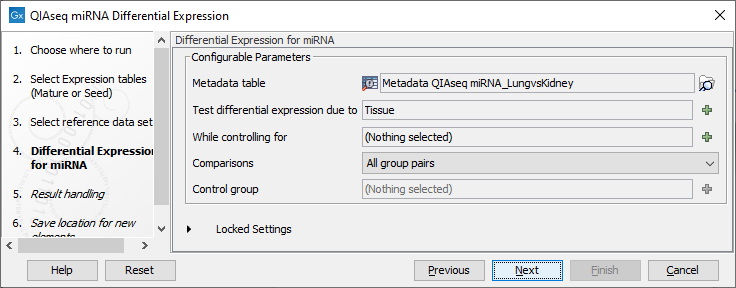
Following this, the parameters for the QIAseq miRNA Differential Expression need to be specified (figure 15.21).

Figure 15.21: Selecting parameters for QIAseq miRNA Differential Expression.
- Metadata table Select a metadata object that associates the selected input objects to metadata used by the RNA-Seq analysis.
- Test differential expression due to Select the factor to be tested for differential expression.
- Comparisons Select groups to be compared. It is possible to choose between "Across groups", "All group pairs", and "Against control group".
- Control group If "Against control group" was selected in "Comparisons", a control group must be selected.
An example of a metadata table is shown in figure 15.22.

Figure 15.22: Select the expression data to be compared.
|
Metadata is required when defining the experimental design in the Differential Expression for miRNA tool, and can be used to add extra layers of insight in the Create Heat Map for miRNA tool. To learn more about how to create a metadata table, how to import a metadata table, or how to associate data elements with metadata, see http://resources.qiagenbioinformatics.com/manuals/clcgenomicsworkbench/current/index.php?manual=Metadata.html. |
In the final step, standard result handling is performed: the selected parameters can be previewed, and an output location must be chosen.
The workflow will output the following files:
- a Gene Set Test table, see http://resources.qiagenbioinformatics.com/manuals/clcgenomicsworkbench/current/index.php?manual=Gene_Set_Test.html.
- a Venn diagram, see http://resources.qiagenbioinformatics.com/manuals/clcgenomicsworkbench/current/index.php?manual=Create_Venn_Diagram_RNA_Seq.html.
- a Statistical comparison table, see http://resources.qiagenbioinformatics.com/manuals/clcgenomicsworkbench/current/index.php?manual=Statistical_comparison_tracks.html. This table can be uploaded to Ingenuity Pathway Analysis.
- an Expression browser, see http://resources.qiagenbioinformatics.com/manuals/clcgenomicsworkbench/current/index.php?manual=Create_Expression_Browser.html.
- a Heat Map, see http://resources.qiagenbioinformatics.com/manuals/clcgenomicsworkbench/current/index.php?manual=Create_Heat_Map_RNA_Seq.html.
