Rarefaction for Clonotypes
The rarefaction curve () is also known as the species accumulation curve (figure 7.19). It shows the expected number of distinct clonotypes discovered as a function of the total number of detected clonotypes, together with the confidence interval (CI), obtained from a normal approximation. The curve is
- interpolated down to 0 clonotypes;
- extrapolated to twice the total number of detected clonotypes.
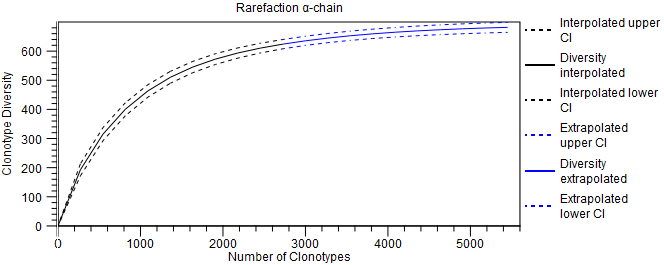
Figure 7.19: Rarefaction plot for the TRA chain. The chain can be changed from the side panel.