Output from Detect MSI Status
Three outputs are produced by the Detect MSI Status tool:
- MSI loci track: An annotation track with MSI loci annotated with predicted stability.
- MSI report: A report summarizing the overall status of the sample and showing length distribution plots of the individual loci.
- Baseline cross-validation report: A report analyzing the quality of the MSI baseline.
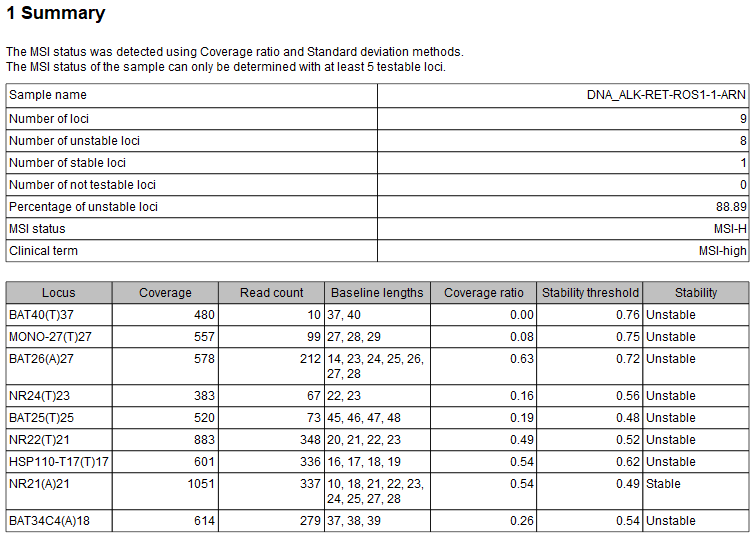
The MSI report contains both combined and per loci information on stability and other descriptive statistics related to the selected detection and test methods. The summary section contains a table of the analyzed loci and whether the individual loci are stable or unstable (figure 8.6).

Figure 8.6: Summary section from the MSI Report for an MSI-high sample.
The following information can be found in the locus table:
- Locus: Name of the locus.
- Coverage: The number of reads intersecting the locus.
- Read count: The number of reads that contains both flanking signatures and have been used for the calculation of the frequency distribution of microsatellite locus lengths as described above.
- Baseline lengths: The set of baseline lengths as determined by the Dispersion measurement settings, see Detect MSI Status for details.
- Coverage ratio / Earth mover's distance: Stability value from the method of choice, see Detect MSI Status for details.
- Stability threshold: Threshold calculated from the baseline in order for the locus to be stable. A locus is stable if the test sample has a value:
- above this threshold for the coverage ratio method.
- below this threshold for the earth mover's distance method.
- Stability: Whether the locus is stable, unstable or N/A (locus is not testable, see Detect MSI Status for details).
If the reads count is low but the coverage is high, it could be an indication that the locus is highly unstable and only few reads are spanning the locus. Investigating the read mapping can help understanding the problems.
Figure 8.6 shows an example of the summary section from an MSI report. In this case, 8 out of 9 loci are evaluated as being unstable using the coverage ratio method, meaning that the overall assessment of the sample is MSI-high. The only stable locus is NR21(A)21, but its coverage ratio (0.54) is only slightly larger than the threshold (0.49). When the value is close to the stability threshold, there is a risk of false evaluation, and in this case, it is likely that the NR21(A)21 locus is actually unstable. For the two first loci (BAT40(T)37 and MONO-27(T)27), on the other hand, there is a large difference between the coverage ratio value and the stability threshold (0.00 vs. 0.76 and 0.08 vs. 0.75), indicating that the loci are highly unstable. It is recommended to study the length distribution plots in the report for a more detailed view on the stability.
The baseline cross-validation report contains a table where the MSI status is presented for each sample in the baseline sample set. The cross-validation analysis verifies whether the baseline and selected parameters are suitable. For this, the MSI status of each sample from the baseline sample set is tested against a baseline created using all other samples of the set. Ideally, it is expected that all samples will be detected as stable (MSS) with a very low proportion of unstable loci. If this is not the case, the parameters might need to be adjusted and/or one or more samples should be removed from the baseline. Note that the cross-validation analysis is dependent on the parameters used for detection (exactly as for a test sample) and therefore each cross-validation is only valid for the selected set of parameter values used in the cross-validation run.
This report can be used together with the Combine Reports tool (see http://resources.qiagenbioinformatics.com/manuals/clcgenomicsworkbench/current/index.php?manual=Combine_Reports.html)
