Volcano plot
The volcano plot shows the relationship between gene/miRNA p-values and fold changes among the samples. The log2 fold changes are plotted on the x-axis, and the -log10 p-values are plotted on the y-axis. You toggle between regular p-values and FDR p-values via the selection on the top right. Features of interest are typically those in the upper left and upper right hand corners of the volcano plot, as these have large fold changes (lie far from x = 0) and are statistically significant (have large y-values).
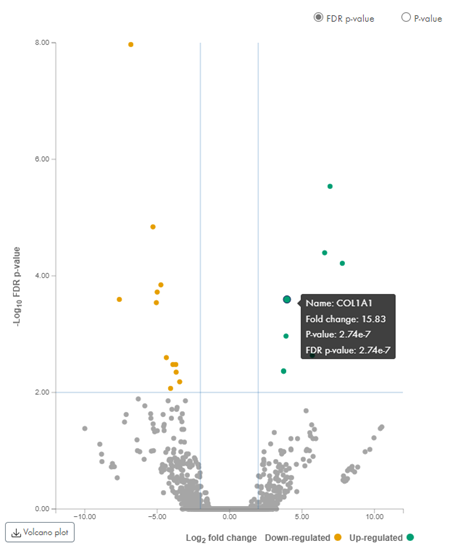
Figure 49: Hover over features in the volcano plot to see names and values.
Features that meet the applied filter settings will be colored blue if down-regulated or red if up-regulated in group 1 relative to group 2.
Hover over the individual features to see name, fold change and p-value (figure 49).
The vertical and horizontal bars represent the filtering settings. These can be dragged to adjust the thresholds. The values in the filtering fields below will change accordingly.
Download volcano plot. To download the volcano plot, hover the plot and click on Volcano plot.