Filter
Underneath the volcano plot, you will find the Filter section (figure 55). It allows you to filter the feature table, volcano plot and heat map by feature name, fold change limits, and either regular or FDR-adjusted p-values, depending on the volcano plot settings. You can enter threshold values directly or adjust them interactively using the horizontal and vertical bars on the volcano plot.
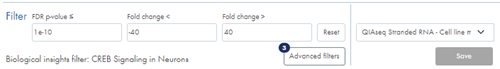
Figure 55: Adjust fold change and p-value, apply advanced filtering and select a biological insights filter to narrow down the list of genes or miRNAs.
Additional filtering options are available via the Advanced filters button. In the dialog, you can filter by biotypes (when available) and by minimum, mean and maximum CPM ((Counts per Million, TMM-adjusted) values per group and across groups (figure 56). Apply multiple filters one at a time:
- Select criterion
- Choose and operator and enter value, or select biotypes
- Click Add filter
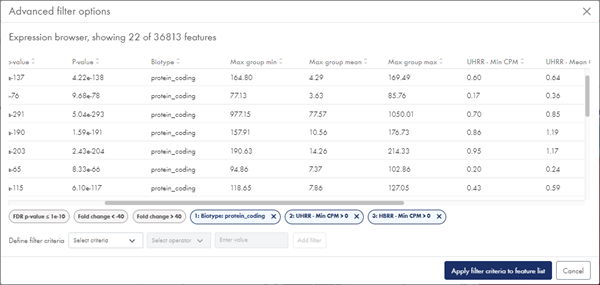
Figure 56: With Advanced filters, you can filter on biotypes and CPM expression values.
Each filter appears as a tag below the dialog table and can be removed by clicking the 'x'. When finished, click Apply filter criteria to feature list.
A badge next to the Advanced filters button shows the number of active advanced filters (figure 55).
Text below the regular filter fields indicates whether a biological insights filter has been applied.
Click on Save to save all filters.
Click on Reset to clear them, or select a saved filter from the drop-down list on the right.
P-value and FDR p-value
- P-value. Standard, uncorrected p-value. Genes/transcripts that are not observed in any sample have undefined p-values and are reported as '-'.
- FDR p-value. The false discovery rate corrected p-value. The FDR-corrected p-value will always be larger than the uncorrected p-value.
The differential expression analysis includes the step Filter on average expression for FDR correction. This filters away some genes prior to the FDR correction. As a result, those genes will have undefined FDR p-values, reported as '-'.
The p-value controls the chance of getting a false positive result. When you apply a statistical test and use a p-value cut-off of 0.05, you should expect 5% of your significant results to be false positives.
When you carry out many tests, e.g. test differential expression for many genes in one experiment, you run into the multiple testing problem: If in a multiple-test scenario 10000 tests turn out significant and for each of these you use a 0.05 p-value cut-off, in total you should expect 500 of those significant results to be false positives. This approach may not be useful in practice.
The False Discovery Rate (FDR) p-value addresses this problem and allows you to control the overall false positive rate in the multiple testing scenario. In this approach it is not the chance of making a false positive call in each individual test that is being controlled, but rather the proportion of false positive tests among all significant test. When you use a FDR-corrected p-value cut-off of 0.05, you should expect 5% of your significant tests to be false positives. Mathematically, the FDR-corrected p-values are obtained from examining the distribution of the traditional p-values across all tests performed, and identifying cut-offs between significant and non-significant values.
Typically, the standard p-value is used in cases where only a few tests are being performed in parallel, whereas the FDR corrected p-value is used when many tests are being performed. Analyzing differential expression across many genes or miRNAs is a example of the latter, i.e. for this use case, the FDR p-value is normally recommended. Using the FDR p-value will result in fewer false positive calls, without much loss of sensitivity.