View and filter results
- Click on one of the differential expression results on the Experiment analyses overview to open up the differential expression result view (figure 14). This view is explained under Differential expression view for more info on this step.
- Filter the feature table at the top left by adjusting the p-value and fold change thresholds. You can do this using the fields in the Filter features section, in the center at the bottom, or by dragging the corresponding threshold bars in the volcano plot.
- Click on Advanced filters to access additional filter criteria like expression values and biotypes.
- Apply a biological insights filter by selecting an item from the Biological insights table, at the bottom on the left.
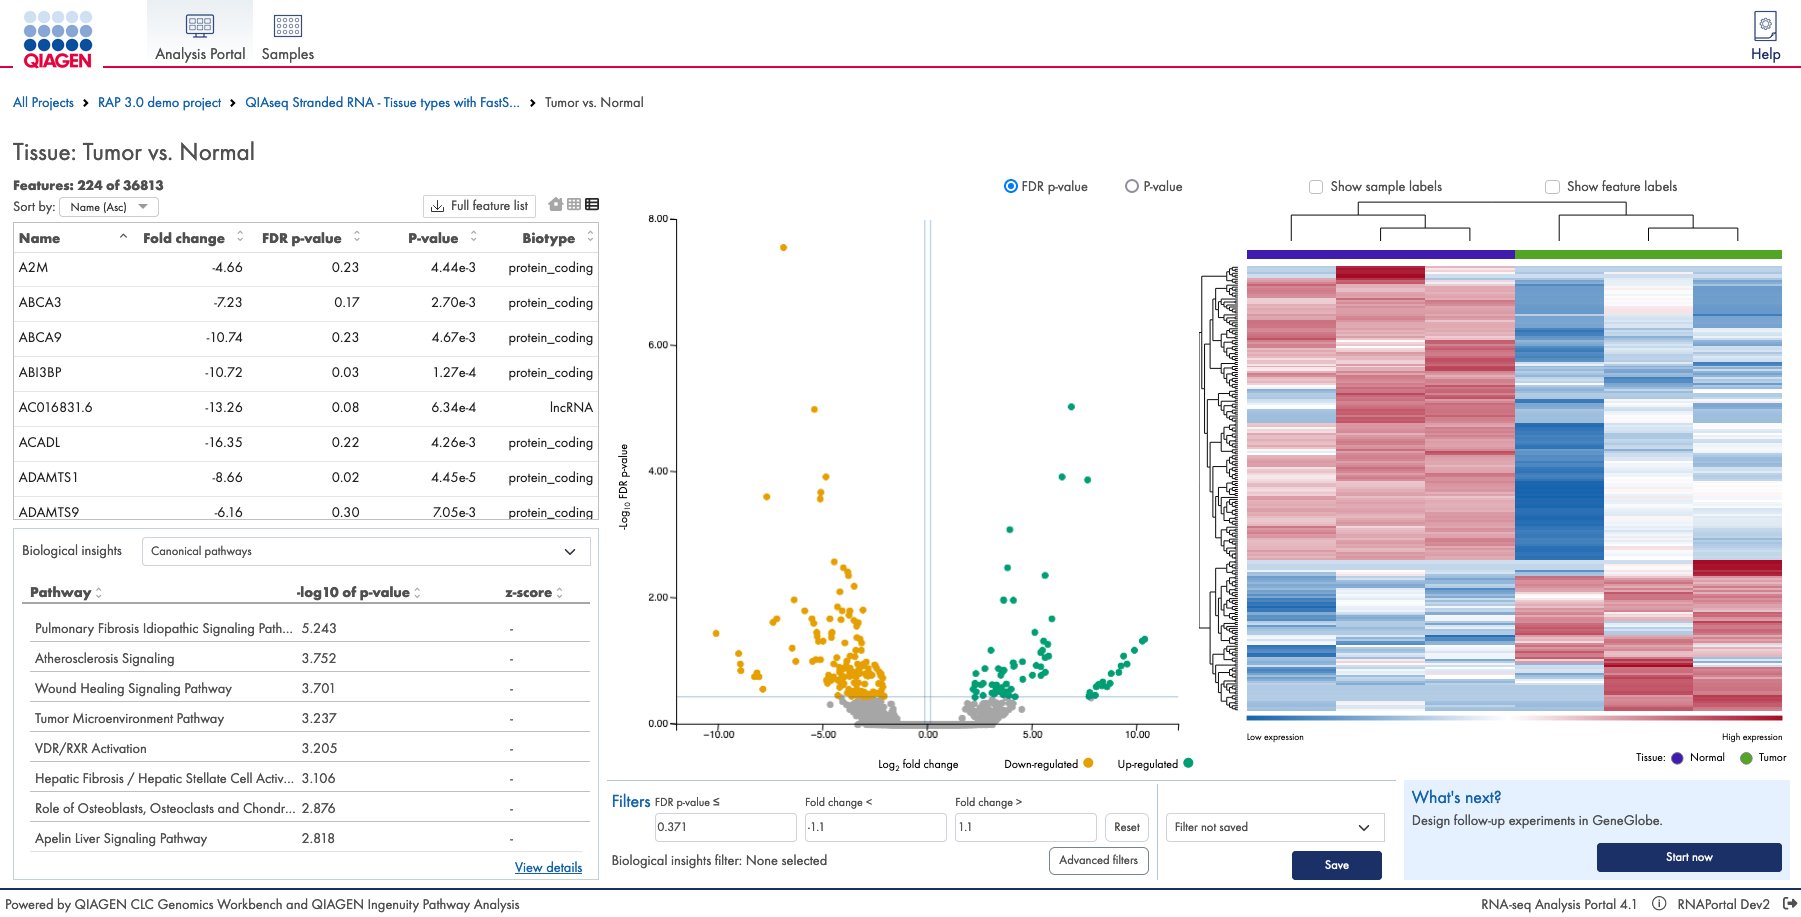
Figure 14: Adjust the p-value and fold change thresholds, and apply advanced and biological insights filters to adjust the feature table contents. The figure shows the 'What's next'-feature available to My QIAGEN users.
When you are satisfied with the filtering and the set of features in the feature table, you can save your filter.
- Click on Save.
- In the Save filter dialog, either go with the auto-generated filter name, or choose a name of your own.
- Click Save.