Experiment summary and QC report
On the experiment analyses overview, the Experiment summary and QC tile is indicated by the PCA plot image (figure 43).
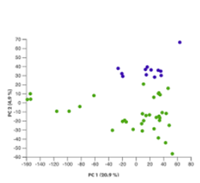
Figure 43: The Experiment summary and QC analysis tile includes a picture of a PCA plot.
Click on the tile to open it.
The Experiment summary and QC analysis result is a report divided into three tabs, Experiment summary, Samples, and Quality control.
Print or download report. To print or download the report, click on Report above the three tabs (figure 44) and select:
- Print view. This opens your browser's print functionality, where you can choose a printer or save the report as a PDF.
- Download as Excel. Download the textual content of the report in .xlsx format.
Experiment summary
The Experiment summary tab lists key information about the experimental design, including the attribute on which the experiment is based, and underlying samples (figure 44).
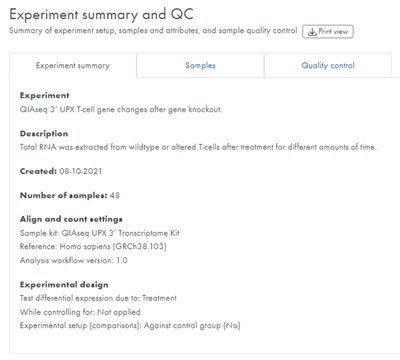
Figure 44: The first tab on the Experiment summary and QC report contains the Experiment summary.
Samples
The Samples tab includes a PCA plot (minimum two samples) and a table of all samples in the experiment. For full experiments that include differential expression results, the table displays sample metadata, and the PCA plot is colored by the experiment's defining attribute (figure 45).
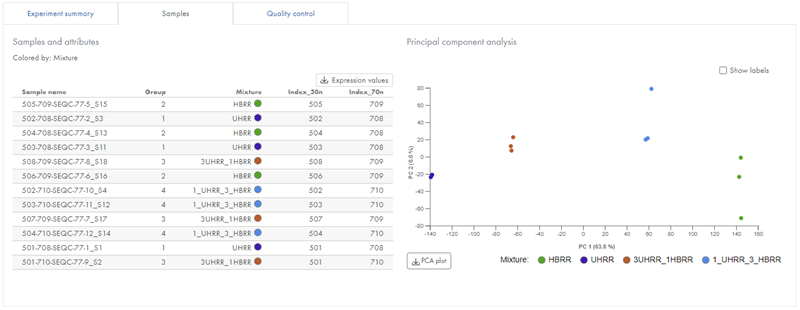
Figure 45: The Samples tab lists samples and their attributes, and allows you to download expression values.
The PCA plot can help with identifying outlying samples for quality control purposes, and can provide you with a feel for the principal causes of variation in the dataset. If you have outlier samples, you may want to run the experiment again without these. If the Quality control tab metrics for outlier samples are skewed, this is additional evidence that you should consider removing them from your experiment.
Download PCA plot. To download the PCA plot, hover over the plot and click PCA plot. In the dialog, select image resolution, and click on Download (figure 46).
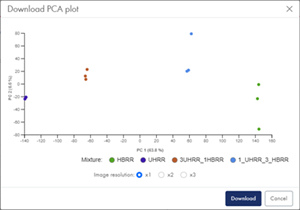
Figure 46: The Download PCA plot dialog with options for image resolution.
Download expression values. To download expression values, click Expression values in the top-right corner and select the data you wish to download.
Available download options vary by sample kit.
CPM values are available only for full experiments that include differential expression results, not for QC experiments.
- miRNA expression value download options
- miRNA, one file per sample. Single-tab file containing mature miRNAs with the following columns: Name, ID, Count, CPM (Counts per million, TMM normalized).
- miRNA and piRNA, all samples. Multi-tab file where each tab contains values for all samples:
- miRNA Count: Name, ID, Count per sample
- miRNA CPM: Name, ID, CPM per sample
- piRNA Count: Name, Count per sample
- All biotypes, one file per sample. Multi-tab file including:
- miRNA: Name, ID, Count, CPM (Counts per million, TMM normalized).
- piRNA: Name, Count
- Other biotypes: Name, ID, Biotype, Count. Features with zero count are excluded.
- IsomiR counts, one file per sample. Single-tab file with the following columns: Name, Sequence, Count, Ambiguous
- RNA expression value download options
- Gene values, one file per sample. Single-tab file with the following columns: Name, ID, Biotype, Count, RPKM (Reads Per Kilobase of exon model per Million mapped reads), TPM (Transcripts per million), CPM (Counts per million, TMM normalized).
- Gene values, all samples. Multi-tab file where each tab contains values for all samples:
- Count: Name, ID, Biotype, Count per sample
- RPKM: Name, ID, Biotype, RPKM per sample
- TPM: Name, ID, Biotype, TPM per sample
- CPM: Name, ID, Biotype, CPM per sample
- Transcript values, one file per sample. Single-tab file with the following columns: Name, ID, Biotype, Count, RPKM (Reads Per Kilobase of exon model per Million mapped reads), TPM (Transcripts per million), CPM (Counts per million, TMM normalized).
Details on CPM, RPKM, and TPM metrics, as well as the tool used to generate IsomiR counts can be found in the product manuals for QIAGEN CLC Genomics Workbench and Biomedical Genomics Analysis plugin:
- https://resources.qiagenbioinformatics.com/manuals/clcgenomicsworkbench/2502/index.php?manual=_expression_browser.html
- https://resources.qiagenbioinformatics.com/manuals//clcgenomicsworkbench/2502/index.php?manual=Extract_IsomiR_Counts.html
- https://resources.qiagenbioinformatics.com/manuals/clcgenomicsworkbench/2502/index.php?manual=Expression_settings.html
Quality control
The Quality control tab displays several tables with sample quality control metrics from the individual Align and count analysis steps. The available metrics differ between sample kits.
The top table, Quality control summary, provides an overview of selected metrics like the number of reads, average quality scores, and mapped reads.
QIAseq miRNA Library Kit
The Quality control tab contains the two related tables Unique search sequences and Reads. Unique search sequences are groups of identical reads. The ratio between corresponding Unique search sequences values and Reads values indicates the redundancy of the particular biotype. In general, a higher level of redundancy is expected for miRNAs than for other biotypes. High redundancy for other biotypes may be indicative of issues with sequencing samples. For additional information on QC metrics, see Appendix E.
RNA sample kits
The Quality control summary metrics Mapped to total rRNA represents the sum of the corresponding cytoplasmic rRNA and mitochondrial rRNA (Mt_rRNA) values and indicates the level of rRNA contamination. It can be used as a measure of whether the rRNA depletion protocol worked as expected. For additional information on QC metrics, see Appendix E.
The Biotype distribution chart and table give insight into where reads mapped (figure 47). For a poly-A enrichment experiment, you expect that the majority of reads correspond to "protein_coding" regions. For other experiment types, a variety of non-coding RNA regions may also be observed. For an rRNA depletion protocol, the percentage of reads mapping to rRNA and Mt_rRNA combined should usually be <15%.
To download the biotype chart, hover the chart and click on Biotype chart.
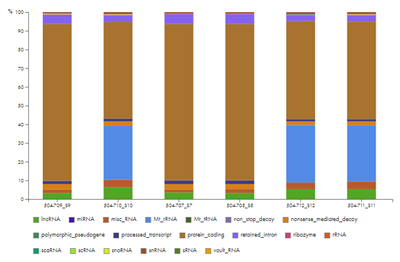
Figure 47: The biotype chart shows the origin of the mapped reads. The large proportion of Mt_rRNA reads for three of the samples is an indication that no rRNA depletion protocol was used, or that if one was used, it did not work as expected.
The sections Taxonomic profile of unmapped reads and Taxonomic profiling summary will hold taxonomic profiling results for samples with more than 100,000 reads and where less than 75% of the reads could be mapped. A high level of unmapped reads could indicate contamination. The taxonomic profiling of the unmapped reads detects if those unmapped reads may originate from bacteria or archaea, and if so from which phyla. The plot (figure 48)and table under Taxonomic profile of unmapped reads show the relative abundance at phylum level.
To download the taxonomic profile chart, hover the chart and click on Taxonomic profile chart chart.
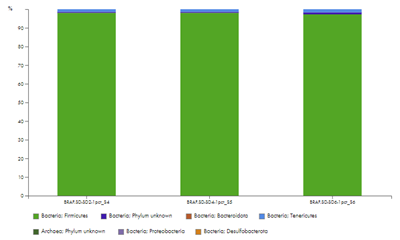
Figure 48: The taxonomic profile chart shows the relative abundance of phyla in unmapped reads of samples where less than 75% of the reads could be mapped.