Biological insights table
The biological insights table at the bottom left is built using QIAGEN Ingenuity Pathway Analysis (IPA) results for your list of differentially expressed genes or miRNAs. The drop-down contains two to four categories, depending on the sample kit (figure 52):
- Canonical pathways
- Upstream regulators (RNA sample kits only)
- Upstream regulators (miRNA) (RNA sample kits only)
- Diseases and functions
Each tab holds up to ten entries.
The information in this table helps with identifying the most significant pathways, whether activated or inhibited, as well as potential upstream regulators and causal relationships associated with your data.
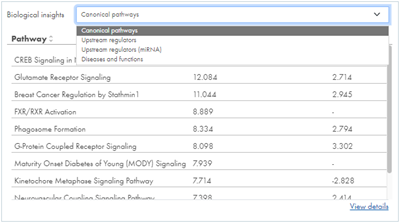
Figure 52: The biological insights table reports QIAGEN Ingenuity Pathway Analysis results in three or four categories.
For each table entry, the -log10 p-value and z-score are listed.
Information on how IPA calculates p-values and z-scores is available at:
Click on View details to get an expanded biological insights table with additional information and values (figure 53). Click on Learn about these values, at the top right side, to go to QIAGEN Ingenuity Pathway Analysis documentation, where information on the statistical calculations behind the values is provided.
Note that for any particular biological insights result, a p-value will always be present, but a z-score may not be. This is expected and is due to how the pathways and biological relationships are constructed.
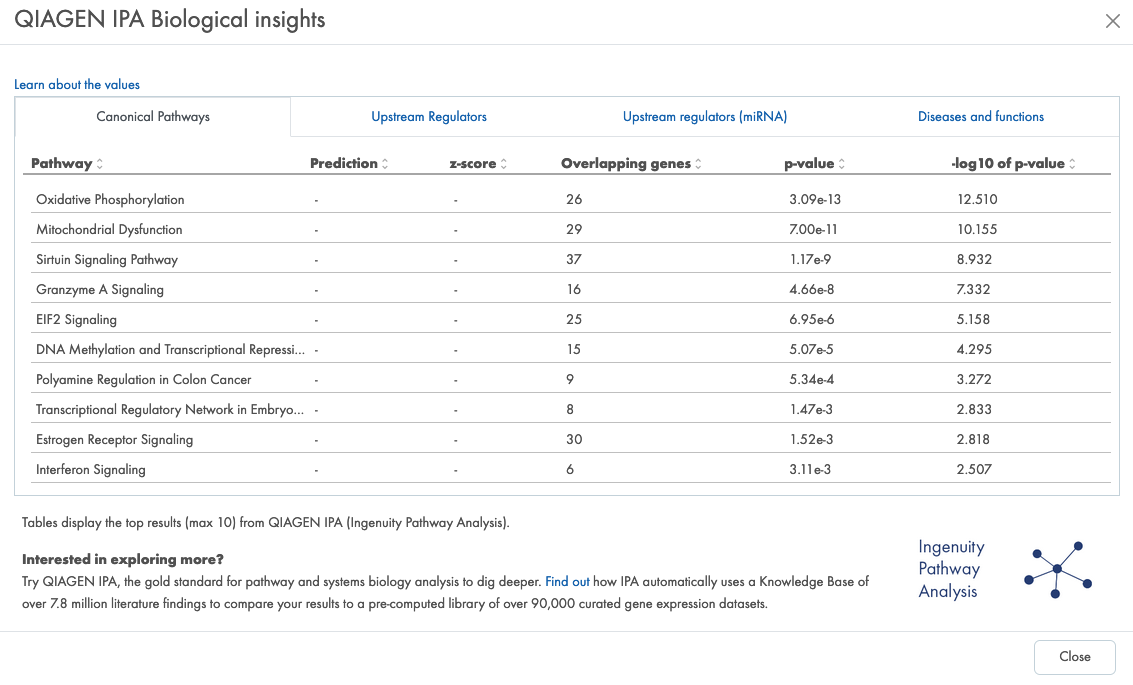
Figure 53: The expanded biological insights table provides additional information.
On the smaller biological insights table, you can click an item to apply this as a biological insights filter. This limits your feature table and heat map contents and volcano plot coloring to only genes or miRNAs associated with the particular item, e.g. a Canonical Pathway. Other filter settings still apply (figure 54). Click on the same item again to remove the biological insights filter.
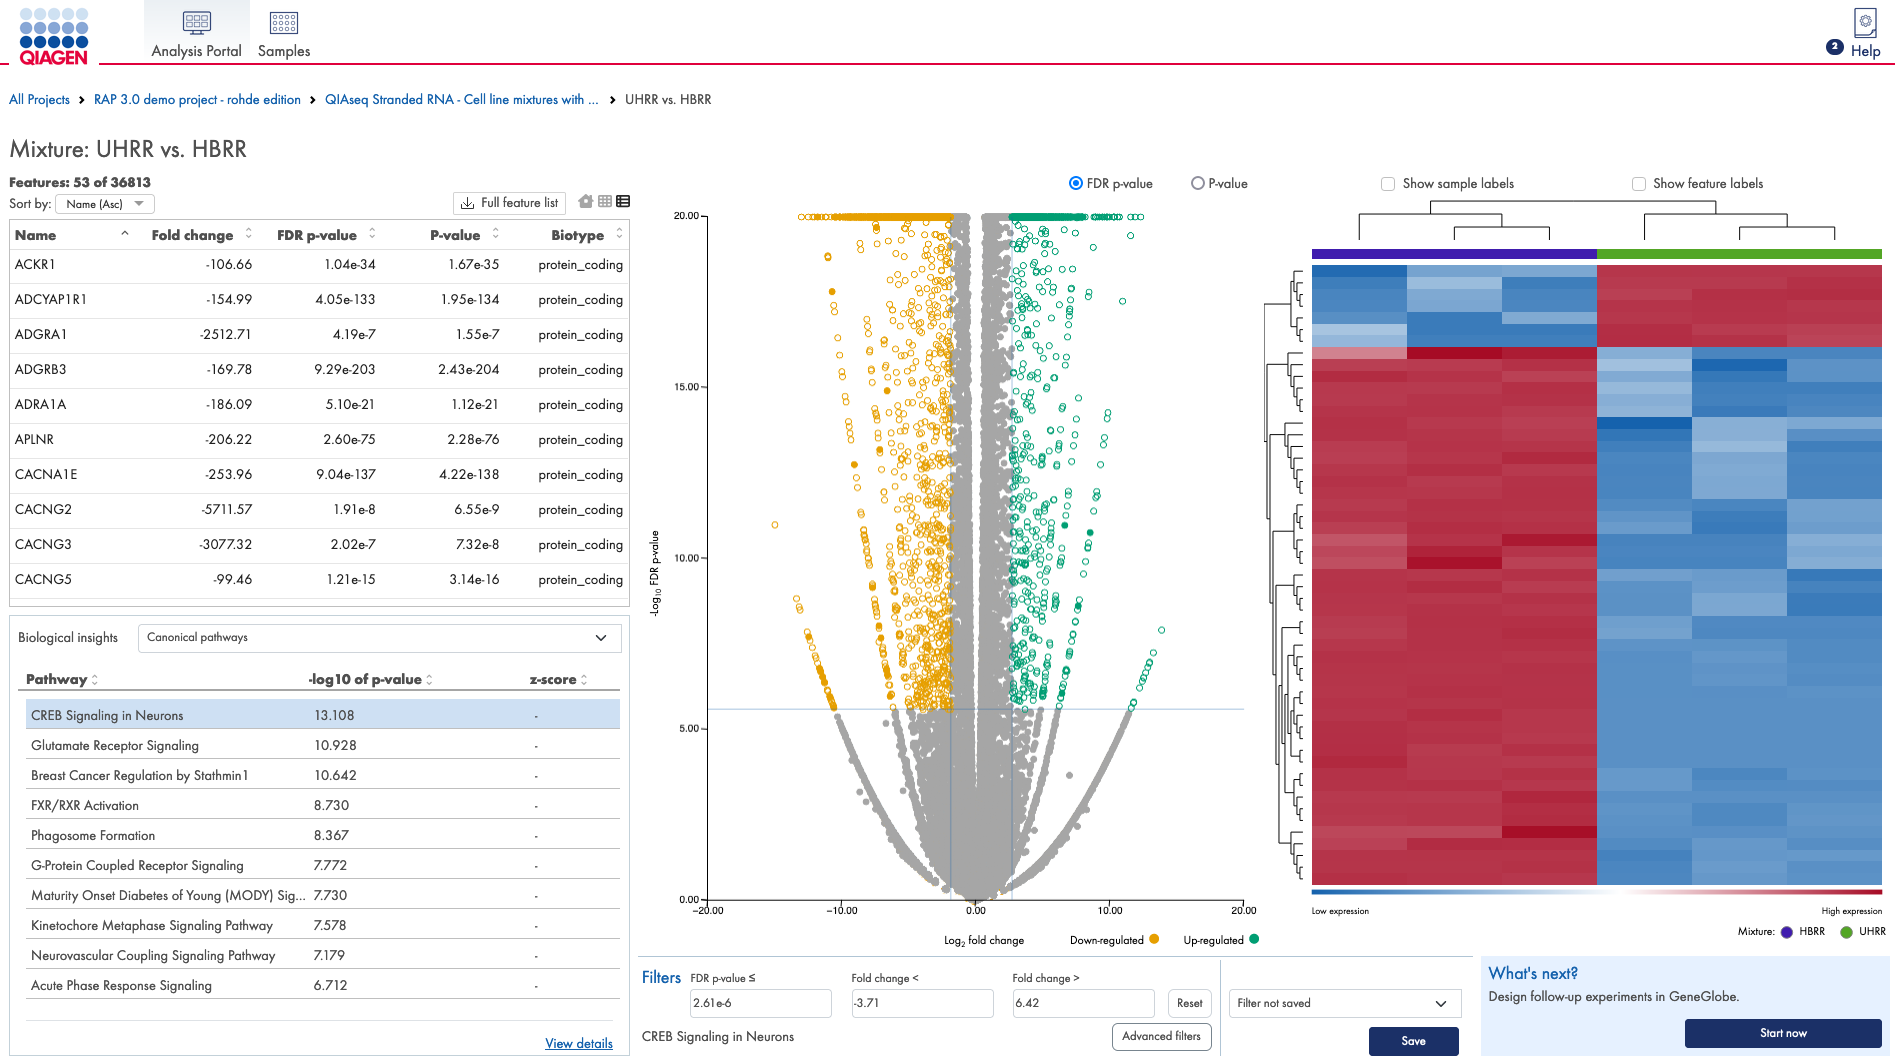
Figure 54: Click on a biological insight table item to limit entries in the feature table and heat map, and coloring on the volcano plot to genes or miRNAs associated with the particular item.